Continuous Profiling
🚀 Quick Start
This guide uses build/docker/docker-compose.yml to start all services, create a host CPU profiling job, and view the flame graph in Grafana.
1. Start Services
First, configure Elasticsearch credentials so that huatuo-bamai and huatuo-apiserver can persist profile data. The config files are volume-mounted into the containers, so edit them directly in the project root.
In huatuo-bamai.conf:
[HTTPServer.Auth]
    BearerToken = "REPLACE_WITH_NODE_TOKEN"

[Storage]
    [Storage.Elasticsearch]
        Address = "http://127.0.0.1:9200"
        Index = "huatuo_bamai"
        Username = "elastic"
        Password = "huatuo-bamai"
In huatuo-apiserver.conf:
[Agent.Auth]
    BearerToken = "REPLACE_WITH_NODE_TOKEN"

[Elasticsearch]
    Address = "http://127.0.0.1:9200"
    Username = "elastic"
    Password = "huatuo-bamai"
    Index = "huatuo_bamai"

[Auth]
    [[Auth.Users]]
        ID = "administrator"
        BearerToken = "REPLACE_WITH_RANDOM_HEX"
        Admin = true
Then start all services from the project root:
docker compose --project-directory ./build/docker up
Run without
-dto observe startup logs. Add-dfor background mode.
| Service | Role | Default Port |
|---|---|---|
huatuo-bamai |
Agent, runs profiler sampling | 19704 |
huatuo-apiserver |
API entry point, creates and dispatches jobs | 12740 |
elasticsearch |
Stores profile data (index: huatuo_bamai) |
9200 |
grafana |
Flame graph visualization | 3000 |
2. Verify Services
In a new terminal, confirm all services are ready:
# Agent health check
$ curl -s http://localhost:19704/version | jq .data.name

"huatuo-bamai"

# API Server health check
$ curl -s http://localhost:12740/version | jq .data.name

"huatuo-apiserver"

# ES index status
$ curl -s -u elastic:huatuo-bamai "http://localhost:9200/_cat/indices/huatuo_bamai?v"

health status index        uuid                   pri rep docs.count docs.deleted store.size pri.store.size dataset.size
yellow open   huatuo_bamai 147fzHJhQ820GjCKFLh5ZQ   1   1         42            0    297.8kb        297.8kb      297.8kb
Set environment variables for subsequent API calls:
API_BASE="http://127.0.0.1:12740"
API_TOKEN="REPLACE_WITH_RANDOM_HEX"
3. Create a Host CPU Profiling Job
Use c language (native, covers C/C++/Go) to sample the entire host for 30 seconds:
# Use the actual hostname of the node
HOSTNAME=$(hostname)

JOB_ID=$(curl -s -X POST \
  -H "Authorization: Bearer ${API_TOKEN}" \
  -H "Content-Type: application/json" \
  -d "{
    \"type\": \"cpu\",
    \"language\": \"c\",
    \"mode\": \"oncpu\",
    \"scope\": \"host\",
    \"duration_seconds\": 30,
    \"hostname\": \"${HOSTNAME}\"
  }" \
  "${API_BASE}/v1/profiling" | jq -r .data.request_id)

echo "Job ID: $JOB_ID"
4. Verify Data in Elasticsearch
Each aggregation window is 10 seconds. A 30-second job produces approximately 3 profile documents. Wait for completion, then verify:
$ curl -s -u elastic:huatuo-bamai "http://localhost:9200/huatuo_bamai/_count" \
  -H "Content-Type: application/json" \
  -d '{"query":{"exists":{"field":"profile_data.profile"}}}' | jq .count

3
5. View the Flame Graph in Grafana
Open the Continuous Profiling (host) dashboard:
- URL: http://localhost:3000/d/continuous-profiling-host (replace
localhost:3000with your environment) - Credentials:
admin / admin(skip the default password change prompt)
Steps:
- Select a time range covering the profiling period
- Choose your
hostnameand settypetoprocess_cpu:cpu:nanoseconds:cpu:nanoseconds - The flame graph loads aggregated call stacks for the selected time range and updates dynamically
- Click a frame to zoom in; use the top table for symbol sorting, filtering, and statistics
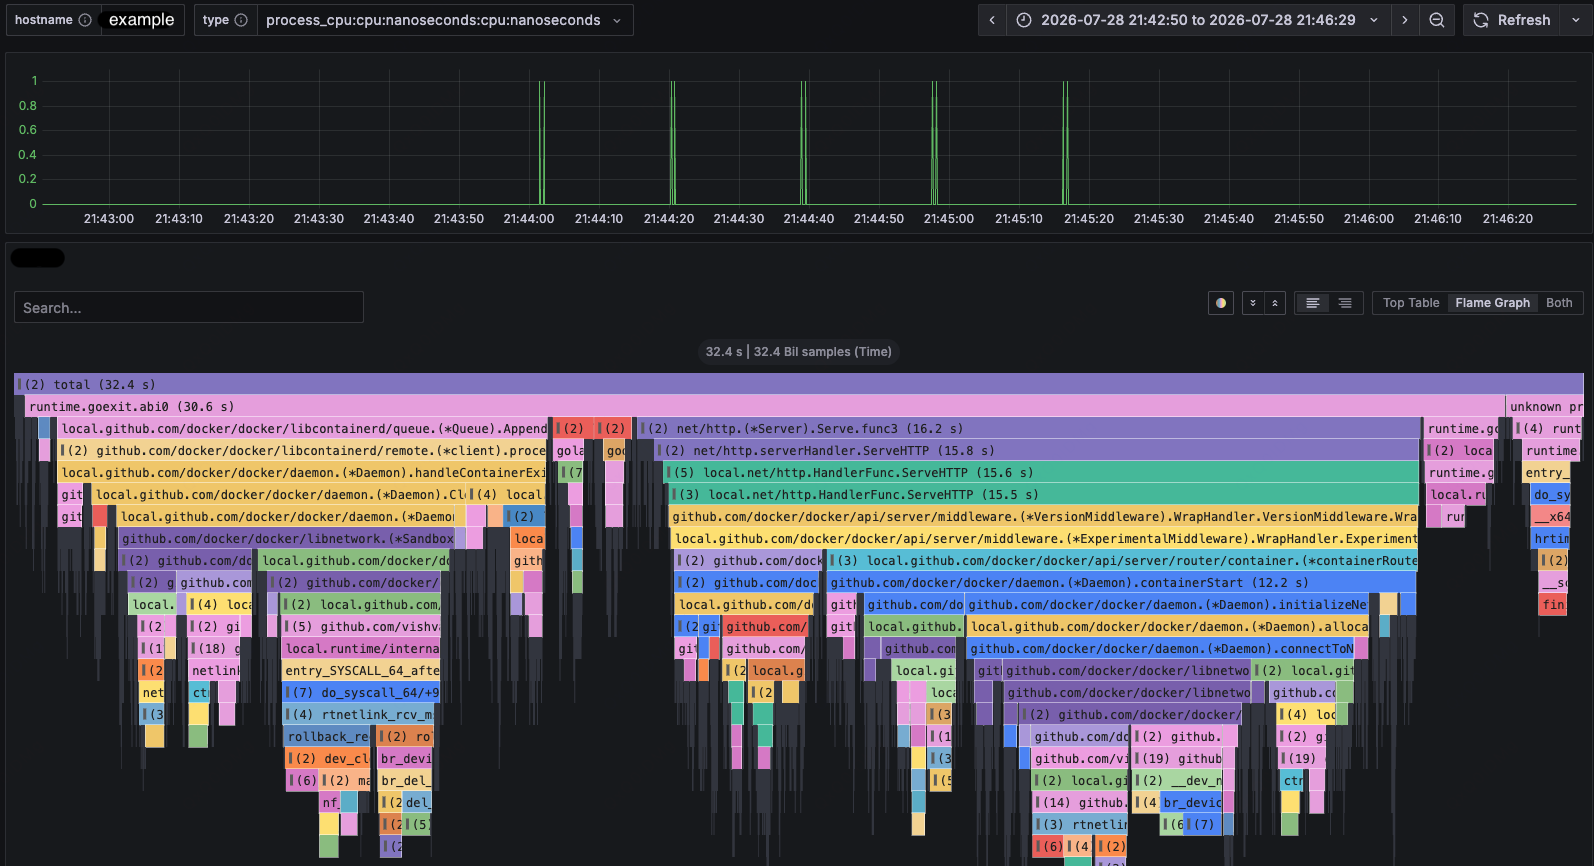
For more profiling dimensions, see the Profiling API section below.
🌐 Profiling API
huatuo-apiserver exposes /v1/profiling for creating, observing, and stopping
Profiling Jobs. Each create request is an independent execution. The Job is
durable in huatuo-apiserver while the Node owns only the in-memory Operation
and profiler process.
Elasticsearch is optional for Job control but required for raw results and Dashboard links. Node and Apiserver must use the same Elasticsearch index.
1. Request Conventions
By default, huatuo-apiserver listens on :12740. The following examples use environment variables for the server address and bearer token:
API_BASE="http://127.0.0.1:12740"
API_TOKEN="REPLACE_WITH_RANDOM_HEX"
Every request must pass the configured bearer token:
Authorization: Bearer REPLACE_WITH_RANDOM_HEX
A non-administrator user requires both /v1/profiling and
/v1/profiling/** permissions. Permissions may include an HTTP method, such as
GET /v1/profiling/**. Successful responses contain only data:
{
  "data": {}
}
Error responses contain a stable code and a human-readable message:
{
  "error": {
    "code": "result_unavailable",
    "message": "Job state does not provide a complete Profiling result"
  }
}
Clients must branch on error.code and must not parse error.message.
2. Query Profiling Capabilities
Before creating a job, query the profiling types, languages, CPU modes, memory modes, and runtime settings supported by the server:
curl -sS \
  -H "Authorization: Bearer ${API_TOKEN}" \
  "${API_BASE}/v1/profiling/capabilities"
data.items is a static versioned capability table. Each item contains:
| Field | Description |
|---|---|
type |
Profiling type: cpu or memory |
language |
Target language |
modes |
Valid mode values for this type/language pair |
supports_binary_match |
Whether binary_match_path is accepted |
supported_scopes |
Valid values for scope |
CPU profiling supports oncpu and offcpu for c, c++, and go;
java and python support only oncpu. Memory profiling supports these combinations:
| Language | mode |
Description |
|---|---|---|
c, c++, go |
virtual_alloc |
Virtual address-space allocation |
c, c++, go |
physical_alloc |
Physical page allocation |
c, c++, go |
physical_usage |
Current physical page residency |
java |
object_alloc |
JVM object allocation |
java |
object_usage |
JVM live objects |
3. Create a Profiling Job
POST /v1/profiling accepts the following JSON fields:
| Field | Required | Description |
|---|---|---|
type |
Yes | Profiling type: cpu or memory |
language |
Yes | Target process language; it must support the selected profiling type |
mode |
Yes | One mode advertised for the selected type/language pair |
duration_seconds |
Yes | Profiling duration in seconds |
hostname |
Yes | Hostname of the node running the target process; used for job scheduling |
scope |
Yes | host or container, as advertised by capabilities |
container_id |
For container scope | Target container ID |
binary_match_path |
No | Executable path matcher when the capability permits it |
Each request creates a new Job, even when its content matches an earlier request. Per-host and process-wide quotas reject excess active Jobs with HTTP 429.
Create a Go CPU profiling job on a host:
curl -sS -i \
  -X POST \
  -H "Authorization: Bearer ${API_TOKEN}" \
  -H "Content-Type: application/json" \
  -d '{
    "type": "cpu",
    "language": "go",
    "mode": "oncpu",
    "scope": "host",
    "duration_seconds": 60,
    "hostname": "node-01"
  }' \
  "${API_BASE}/v1/profiling"
Create a Java live-object profiling job in a container:
curl -sS -i \
  -X POST \
  -H "Authorization: Bearer ${API_TOKEN}" \
  -H "Content-Type: application/json" \
  -d '{
    "type": "memory",
    "language": "java",
    "mode": "object_usage",
    "scope": "container",
    "duration_seconds": 60,
    "container_id": "9f4c2f1a8b7d",
    "hostname": "node-01"
  }' \
  "${API_BASE}/v1/profiling"
A successful request returns 201 Created. The Location response header identifies the new job, and the response body contains the job ID used by subsequent requests:
{
  "data": {
    "request_id": "<profile-job-id>",
    "hostname": "node-01",
    "duration_seconds": 60,
    "scope": "host",
    "type": "cpu",
    "language": "go",
    "mode": "oncpu",
    "status": "pending",
    "created_at": "2026-08-24T10:00:00Z",
    "updated_at": "2026-08-24T10:00:00Z"
  }
}
JOB_ID="<profile-job-id>"
4. List Profiling Jobs
GET /v1/profiling supports these query parameters:
| Parameter | Default | Description |
|---|---|---|
limit |
100 |
Page size; must be between 1 and 1000 |
offset |
0 |
Starting offset; must be greater than or equal to 0 |
List the 20 most recent Profiling Jobs:
curl -sS -G \
  -H "Authorization: Bearer ${API_TOKEN}" \
  --data-urlencode "limit=20" \
  --data-urlencode "offset=0" \
  "${API_BASE}/v1/profiling"
The server always limits the result to Profiling Jobs and orders them by
created_at descending. data.items contains the job array. data.limit and
data.offset are the effective pagination parameters, and data.has_more
indicates whether another page is available. Non-administrator users can list
only jobs they created.
5. Get a Profiling Job
curl -sS \
  -H "Authorization: Bearer ${API_TOKEN}" \
  "${API_BASE}/v1/profiling/${JOB_ID}"
The data object contains the job details:
| Field | Description |
|---|---|
request_id |
Profiling Job ID used by all follow-up requests |
container_id |
Target container ID; omitted for host jobs |
hostname |
Target node hostname |
duration_seconds |
Requested profiling duration in seconds |
scope |
host or container |
type |
cpu or memory |
language |
Target process language |
mode |
Profiling mode selected from the capability table |
binary_match_path |
Executable path matcher; omitted when unused |
status |
Current job status |
terminal |
Terminal details {outcome, reason, message}; omitted while active |
created_at |
Job creation time |
updated_at |
Last Job state update time |
started_at |
Time execution started; omitted until observed running |
ended_at |
Terminal status time; omitted while the job is active |
result_url |
Dashboard URL returned by the detail endpoint when a complete result is available |
Profiling jobs use these statuses:
| Status | Description |
|---|---|
pending |
The job has been created and is waiting for the Agent |
running |
The Agent is collecting profiling data |
stopping |
A stop request has been persisted and is being applied asynchronously |
terminal |
The job has ended; inspect terminal.outcome for the result |
terminal.outcome is completed, failed, stopped, or unknown. For
failed, inspect terminal.reason and terminal.message. stopped means the
job was actively stopped and its result may be incomplete. unknown means the
Apiserver cannot verify the final Operation status, but a durably published
result may still be available.
operation_lost and execution_timed_out are terminal reason codes, not Job
statuses. Other failure codes include pending or stop deadline expiry, Node
unavailability, execution-capacity exhaustion, start or execution failure,
invalid_node_request for a Node request constructed incorrectly by the
Apiserver, and protocol errors.
6. Get Raw Profiling Data
GET /v1/profiling/:request_id/raw returns raw profiling windows only for a
Job whose terminal.outcome is completed or unknown and whose durable
publication marker exists. A missing or expired marker returns
result_not_found. Active Jobs return result_not_ready; failed and
stopped Jobs return
result_unavailable.
The response can be large, so it can be written directly to a file:
curl -sS \
  -H "Authorization: Bearer ${API_TOKEN}" \
  -o profile-raw.json \
  "${API_BASE}/v1/profiling/${JOB_ID}/raw?limit=100&offset=0"
The profiling windows are in data.items; data.limit, data.offset, and
data.has_more describe the page. Each item contains uploaded_timestamp,
started_timestamp, profile_type, and the pprof-compatible profile payload.
An empty, durably published result is a successful response with an empty
items array. limit defaults to 20 and accepts 1–100. Explicit limit=0
returns a parameter error; omitted limits use the default. If the encoded
profile data exceeds 64 MiB, the server returns 413 result_too_large; retry
with a smaller limit.
Flamegraph queries consume matching windows in batches of 100 and merge them incrementally, up to 100000 windows per request. A one-hour profile with one window per second therefore includes all 3600 windows. More than 100000 windows returns an error asking for a narrower range or filters. Query or merge errors never return a partial flamegraph. Raw Profile pages remain scoped to a Job; their page limit does not cap the full flamegraph query.
7. Stop a Profiling Job
Stop is an asynchronous intent. It is accepted for pending, running, or
already stopping Jobs:
curl -sS \
  -X POST \
  -H "Authorization: Bearer ${API_TOKEN}" \
  "${API_BASE}/v1/profiling/${JOB_ID}/stop"
A successful request returns 200 OK with the current Job snapshot. A terminal
Job returns 409 Conflict. Stopped Jobs do not expose results because their
final data may be incomplete.
📖 profiler CLI Overview
profiler is HUATUO’s standalone performance profiling CLI. It samples host processes or processes inside containers without requiring huatuo-apiserver, Elasticsearch, or Grafana. The tool supports C, C++, Go, Java, and Python processes and writes call stacks as folded stacks or SVG flame graphs.
C, C++, and Go use the eBPF-based native collector to observe on-CPU usage, off-CPU blocking and scheduling delay, virtual memory allocation, physical memory allocation, and physical memory residency. Java uses async-profiler to observe CPU usage, object allocation, and live objects. Python uses py-spy to observe CPU usage. The results can be used to locate hot functions, attribute memory growth, analyze processes inside containers, and preserve performance data for later diagnosis.
The remainder of this section covers standalone use of _output/bin/profiler. For service-based continuous profiling, see the Profiling API section above.
🎯 Use Cases
1. Locate CPU Hotspots and Call Paths
Sample the call stacks of C, C++, Go, Java, or Python processes at a fixed frequency and use stack width to identify the primary consumers of CPU time. The native collector can also limit sampling to selected CPUs with --cpuid, which is useful for analyzing CPU-pinned workloads or per-CPU hotspots.
2. Attribute Native Process Memory
Observe virtual address-space allocation, physical page allocation, and current physical page residency for C, C++, and Go processes. These modes distinguish between how much address space was requested, how much physical memory was allocated, and how much physical memory remains resident. They help locate call paths responsible for mmap activity, page-fault allocation, and resident memory growth.
3. Analyze JVM Object Allocation and Live Objects
Use async-profiler to collect Java object allocation or live-object call stacks. Object allocation profiles help locate high allocation rates and sources of GC pressure. Live-object profiles help identify objects that remain referenced during the collection window and the paths where they were allocated.
4. Analyze Containers and Multi-process Workloads
Use a container ID to resolve and profile target processes inside Docker or containerd workloads. Java and Python also accept comma-separated PID lists and can limit the number of concurrently running collector subprocesses, which is useful for service replicas and parent-child process groups.
🚀 Usage
1. Build and Runtime Requirements
Build all artifacts from the repository root:
make build
The resulting executable is _output/bin/profiler. Native profiling depends on Linux eBPF, perf events, and the BPF objects built from this repository. It generally requires root privileges and a kernel.perf_event_paranoid setting that permits sampling. Java profiling requires async-profiler; --tool-path points to the shared tool root containing bin/asprof and lib/libasyncProfiler.so. Python profiling requires py-spy under the same root.
Display the complete help for the current version:
_output/bin/profiler --help
The basic command structure is:
sudo _output/bin/profiler \
  --type <cpu|memory> \
  --language <c|c++|go|java|python> \
  --pid <pid> \
  --duration 30 \
  --aggr-interval 10 \
  --output-format flamegraph \
  --output-path ./profiles
--type and --language are required. Java, Python, and native memory profiling require exactly one target specified with either --pid or --container-id. Native CPU profiling can sample the entire host when neither target is specified.
2. General CLI Options
| Option | Default | Scope | Description |
|---|---|---|---|
--type, -t |
None | All | Profile type: cpu or memory; required |
--language, -l |
None | All | Target language: c, c++, go, java, or python; required |
--pid, -p |
None | All | Target PID; Java and Python accept comma-separated PIDs, while native profiling accepts at most one PID |
--container-id |
None | All | Target container ID; mutually exclusive with --pid |
--duration, -d |
10 |
All | Total profiling duration in seconds; minimum 1 |
--aggr-interval |
10 |
All | Aggregation interval in seconds; must not exceed the duration |
--freq, -F |
99 |
CPU | Samples collected per second; maximum 1000 for Java |
--output-path |
. |
Local output | Output directory, not an output file name |
--output-format |
collapsed |
All | collapsed, flamegraph, svg, or remote |
--output-storage |
/var/run/huatuo-toolstream.sock |
remote |
Unix socket used for remote upload |
--max-concurrent-procs |
0 |
Java, Python | Maximum concurrent collector subprocesses; 0 means unlimited |
--tool-path |
None | Java, Python | Shared external tool root; required |
--binary-match-path |
None | Java, Python | Executable path used to match target processes |
--huatuo-api-address |
127.0.0.1:19704 |
Container targets | HUATUO API address used to resolve container metadata |
--tracer-id |
Empty; generated internally for local output | All; required for remote |
Stable profiling task ID used by toolstream and remote storage |
--enable-pprof |
false |
Profiler itself | Expose Go pprof endpoints for the profiler process on :6000 |
--version-format |
text |
Version query | Output format for --version: text, json, or short |
--help, -h |
- | All | Display command help |
--version, -v |
- | All | Display version and build information |
Native profiling options:
| Option | Default | Scope | Description |
|---|---|---|---|
--memory-mode |
None | Native memory, Java memory | Memory profiling mode; required with --type memory |
--cpuid |
All CPUs | Native CPU | Comma-separated CPU list or ranges; off-CPU samples use the task’s switch-out CPU |
--cpu-mode |
oncpu |
Native CPU | oncpu for frequency sampling or offcpu for blocked/runqueue time attribution |
--require-hardware-pmu |
false |
Native on-CPU | Require hardware PMU sampling; fail instead of falling back to the software CPU clock |
--offcpu-phase |
all |
Native off-CPU | Accumulate all, blocked, or runqueue time |
--offcpu-min-duration-us |
1000 |
Native off-CPU | Discard phases shorter than this duration in microseconds |
--offcpu-stats |
false |
Native off-CPU | Collect BPF diagnostic statistics; adds overhead to error and cleanup paths |
--thread-group |
false |
Native | Also profile other threads in the target PID’s thread group |
--physical-memory-probability |
100 |
Native physical memory | Physical memory event sampling probability from 1 to 100 |
--log-bpf-debug |
false |
Native | Emit BPF debug events; not recommended for normal profiling |
Logging options:
| Option | Default | Description |
|---|---|---|
--log-level |
error |
trace, debug, info, warn, or error |
--log-file |
stdout |
Log file path, or stdout |
--log-size |
100 |
Log rotation size in MB; 0 disables rotation; applies only to file output |
--verbose |
false |
Equivalent to --log-level debug --log-file stdout and overrides both explicit logging options |
3. Observing C, C++, and Go
C, C++, and Go use the same native eBPF collector; only the --language value changes. CPU mode counts call-stack samples and includes user-space and kernel-space stacks when symbols can be resolved.
sudo _output/bin/profiler \
  --type cpu \
  --language go \
  --pid 12345 \
  --duration 30 \
  --aggr-interval 10 \
  --freq 99 \
  --output-format flamegraph \
  --output-path ./profiles/go-cpu
Add --thread-group to include worker threads in the same process. Add --cpuid 2,4-7 to limit collection to selected CPUs. Native CPU profiling also supports container-level and host-level collection:
Native on-CPU profiling first uses hardware CPU-cycle events and falls back to
the software CPU clock when the hardware PMU is unavailable. --freq remains
samples per second for either source. Use --require-hardware-pmu when software
clock fallback would hide IRQ-disabled CPU time.
# Profile a specific container
sudo _output/bin/profiler \
  --type cpu --language c --container-id <container-id> \
  --duration 30 --aggr-interval 10 \
  --output-format collapsed --output-path ./profiles/container

# Profile the host without specifying a PID or container
sudo _output/bin/profiler \
  --type cpu --language c \
  --duration 30 --aggr-interval 10 \
  --output-format flamegraph --output-path ./profiles/host
To attribute time spent outside the CPU to the call path that descheduled, select off-CPU mode:
sudo _output/bin/profiler \
  --type cpu --language go --pid 12345 --thread-group \
  --cpu-mode offcpu --offcpu-phase all \
  --cpuid 2,4-7 \
  --offcpu-min-duration-us 1000 \
  --duration 30 --aggr-interval 10 \
  --output-format flamegraph --output-path ./profiles/go-offcpu
Off-CPU output is event-driven, so --freq does not apply. With --cpuid, an interval is collected only when the task switches out from a selected CPU; later wakeup or switch-in on another CPU does not change that attribution. Flame graphs use nanoseconds directly and add roots such as off-CPU blocked, scheduling delay (preempted), and scheduling delay (yielded). The all phase includes blocked and runqueue time but keeps them separated by these roots. A single stable BPF stack map is used so a long sleep cannot be resolved against a later rotating stack-map generation.
Native memory profiling supports these dimensions:
--memory-mode |
Measurement | Suitable for |
|---|---|---|
virtual_alloc |
Virtual address-space allocation and its call stacks | Excessive mmap activity and address-space growth |
physical_alloc |
Physical memory newly allocated during the collection window | Physical page allocation triggered by page faults and allocation-rate analysis |
physical_usage |
Physical memory still resident at collection time | Sources of resident memory and paths retaining physical pages |
sudo _output/bin/profiler \
  --type memory \
  --language c++ \
  --memory-mode physical_usage \
  --pid 12345 \
  --thread-group \
  --physical-memory-probability 100 \
  --duration 30 \
  --aggr-interval 10 \
  --output-format flamegraph \
  --output-path ./profiles/native-memory
--physical-memory-probability applies only to physical_alloc and physical_usage. Lowering it reduces processing for high-frequency memory events, but flame-graph values are then estimates based on sampled events rather than counts of every event.
4. Observing Java
Java CPU profiling depends on async-profiler. It supports a single PID, a container, or multiple PIDs:
_output/bin/profiler \
  --type cpu \
  --language java \
  --pid 12345,12346 \
  --tool-path /opt/huatuo/tools \
  --max-concurrent-procs 2 \
  --duration 30 \
  --aggr-interval 10 \
  --freq 99 \
  --output-format flamegraph \
  --output-path ./profiles/java-cpu
Java memory profiling supports two dimensions:
--memory-mode |
Measurement | Suitable for |
|---|---|---|
object_alloc |
Objects allocated during the collection window and their allocation call stacks | High allocation rates, short-lived objects, and sources of GC pressure |
object_usage |
Live objects and their allocation call stacks | Long-lived objects, sources of heap usage, and suspected memory leaks |
_output/bin/profiler \
  --type memory \
  --language java \
  --memory-mode object_usage \
  --pid 12345 \
  --tool-path /opt/huatuo/tools \
  --duration 30 \
  --aggr-interval 10 \
  --output-format flamegraph \
  --output-path ./profiles/java-memory
To target a container, replace --pid with --container-id <container-id>. If a container has multiple candidate processes, use --binary-match-path to select the target executable path.
5. Observing Python
Python currently supports CPU profiling only. --aggr-interval must equal --duration, so one collection produces one aggregation window. --tool-path points to the shared tool root containing py-spy.
_output/bin/profiler \
  --type cpu \
  --language python \
  --pid 12345,12346 \
  --tool-path /opt/huatuo/tools \
  --max-concurrent-procs 2 \
  --duration 30 \
  --aggr-interval 30 \
  --freq 99 \
  --output-format flamegraph \
  --output-path ./profiles/python-cpu
Python does not support --type memory. Use a separate memory analysis tool for Python memory profiling; the current profiler command does not invoke memray to generate Python memory profiles.
6. Choosing a Flame Graph and Output Format
| Format | Output | When to use it |
|---|---|---|
collapsed |
perf_<Unix timestamp>.folded; each line contains a semicolon-separated call stack followed by a count |
Scripted searches, result comparison, or rendering later with another flame-graph tool |
flamegraph |
flamegraph_<Unix timestamp>.svg; an SVG with embedded interaction scripts |
Default format for manual analysis; supports searching, zooming, and inspecting frame values in a browser |
svg |
The same interactive SVG as flamegraph |
Compatibility with callers that explicitly request SVG; currently equivalent to flamegraph |
remote |
No local flame graph; uploads pprof-compatible data through a Unix socket | Integration with the HUATUO storage pipeline; not suitable for offline viewing |
A flame graph shows the call direction from bottom to top. Rectangle width represents the cumulative value for that call stack in the selected profiling mode. For CPU profiles, width represents the proportion of CPU time derived from sample counts. For memory profiles, it represents virtual allocation, physical allocation, physical residency, Java object allocation, or live-object volume, depending on the selected mode. Horizontal position does not represent chronological order.
Example folded stacks:
main;handleRequest;parsePayload 428
main;handleRequest;writeResponse 172
Choose collapsed when you need to retain raw data and later render it with different colors or filters. Choose flamegraph when you want to inspect hotspots directly. remote depends on the HUATUO toolstream Unix socket, requires a non-empty --tracer-id, and should not be selected for standalone offline use.
7. Reproducing Integration Test Examples
The repository’s integration tests provide executable end-to-end examples. Each test creates a target process, runs profiler, and verifies the expected call stack in the output:
# Native CPU
sudo ./integration/run.sh test_profiler_native_cpu.sh

# Native off-CPU blocking and scheduling delay
sudo ./integration/run.sh test_profiler_native_cpu_offcpu.sh

# Native virtual and physical memory
sudo ./integration/run.sh test_profiler_native_memory_virtual_alloc.sh
sudo ./integration/run.sh test_profiler_native_memory_physical_usage.sh

# Java CPU and memory
sudo ./integration/run.sh test_profiler_java_cpu_multi_pid.sh
sudo ./integration/run.sh test_profiler_java_memory_usage_alloc.sh

# Python multi-process CPU
sudo ./integration/run.sh test_profiler_python_cpu_multi_pid.sh
Container, thread-group, and CPU-selection examples are available in test_profiler_native_cpu_container.sh, test_profiler_native_cpu_thread_group.sh, and test_profiler_native_cpu_cpuid.sh, respectively. Run make build first and configure the Java or Python profiler path in integration/env.sh as needed.
⚙️ How It Works
profiler first selects a collector based on the language and profile type. The native on-CPU collector attaches eBPF programs to perf events; off-CPU mode attaches scheduler switch, wakeup, exit, and task-free tracepoints. Native memory collectors record allocation and release paths through kernel events. The Java and Python collectors start async-profiler and py-spy subprocesses, respectively. Collected records enter a common aggregation pipeline, which merges counts by call stack and then writes a local file or uploads the result to remote storage.
flowchart LR
    CLI[profiler CLI options] --> Select{Language and profile type}
    Select -->|C/C++/Go| Native[Native eBPF collector]
    Select -->|Java| Java[async-profiler]
    Select -->|Python| Python[py-spy]
    Native --> Queue[Sample record queue]
    Java --> Queue
    Python --> Queue
    Queue --> Aggregate[Aggregate by call stack]
    Aggregate --> Folded[Collapsed stacks]
    Aggregate --> SVG[Interactive SVG flame graph]
    Aggregate --> Remote[Remote upload through Unix socket]
--duration controls the collection lifetime, while --aggr-interval controls the snapshot interval for remote uploads. Local collapsed, flamegraph, and svg modes write the final aggregate when collection ends. remote creates and uploads snapshots at the aggregation interval. The queue decouples collection from symbolization, aggregation, and output so file rendering does not block the sampling path.