This is the multi-page printable view of this section. Click here to print.
Key Feature
- 1: Kernel-Wide Insight
- 2: Instant Observability
- 3: AutoTracing
- 4: Continuous Profiling
- 5: Hardware Events
1 - Kernel-Wide Insight
Metrics supported in the current version:
CPU
Scheduling
The following metrics allow observation of process scheduling latency, i.e., the time from when a process becomes runnable (placed in the run queue) until it actually starts executing on the CPU.
# HELP huatuo_bamai_runqlat_container_latency cpu run queue latency for the containers
# TYPE huatuo_bamai_runqlat_container_latency gauge
huatuo_bamai_runqlat_container_latency{container_host="coredns-855c4dd65d-8v5kg",container_hostnamespace="kube-system",container_level="burstable",container_name="coredns",container_type="normal",host="hostname",region="dev",zone="0"} 226
huatuo_bamai_runqlat_container_latency{container_host="coredns-855c4dd65d-8v5kg",container_hostnamespace="kube-system",container_level="burstable",container_name="coredns",container_type="normal",host="hostname",region="dev",zone="1"} 0
huatuo_bamai_runqlat_container_latency{container_host="coredns-855c4dd65d-8v5kg",container_hostnamespace="kube-system",container_level="burstable",container_name="coredns",container_type="normal",host="hostname",region="dev",zone="2"} 0
huatuo_bamai_runqlat_container_latency{container_host="coredns-855c4dd65d-8v5kg",container_hostnamespace="kube-system",container_level="burstable",container_name="coredns",container_type="normal",host="hostname",region="dev",zone="3"} 0

# HELP huatuo_bamai_runqlat_latency cpu run queue latency for the host
# TYPE huatuo_bamai_runqlat_latency gauge
huatuo_bamai_runqlat_latency{host="hostname",region="dev",zone="0"} 35100
huatuo_bamai_runqlat_latency{host="hostname",region="dev",zone="1"} 0
huatuo_bamai_runqlat_latency{host="hostname",region="dev",zone="2"} 0
huatuo_bamai_runqlat_latency{host="hostname",region="dev",zone="3"} 0
| Metric | Description | Unit | Target | Source | Labels |
|---|---|---|---|---|---|
| runqlat_container_latency | scheduling latency histogram buckets: zone0: 0–10 ms zone1: 10–20 ms zone2: 20–50 ms zone3: 50+ ms |
count | Container | eBPF | container_host, container_hostnamespace, container_level, container_name, container_type, host, region, zone |
| runqlat_latency | scheduling latency histogram buckets: zone0, 0~10ms zone1, 10-20ms zone2, 20-50ms zone3, 50+ms |
count | Host | eBPF | host, region, zone |
SoftIRQ
SoftIRQ response latency on different CPUs (currently only NET_RX and NET_TX are collected).
# HELP huatuo_bamai_softirq_latency softirq latency
# TYPE huatuo_bamai_softirq_latency gauge
huatuo_bamai_softirq_latency{cpuid="0",host="hostname",region="dev",type="NET_RX",zone="0"} 125
huatuo_bamai_softirq_latency{cpuid="0",host="hostname",region="dev",type="NET_RX",zone="1"} 2
huatuo_bamai_softirq_latency{cpuid="0",host="hostname",region="dev",type="NET_RX",zone="2"} 0
huatuo_bamai_softirq_latency{cpuid="0",host="hostname",region="dev",type="NET_RX",zone="3"} 0
huatuo_bamai_softirq_latency{cpuid="0",host="hostname",region="dev",type="NET_TX",zone="0"} 0
huatuo_bamai_softirq_latency{cpuid="0",host="hostname",region="dev",type="NET_TX",zone="1"} 0
huatuo_bamai_softirq_latency{cpuid="0",host="hostname",region="dev",type="NET_TX",zone="2"} 0
huatuo_bamai_softirq_latency{cpuid="0",host="hostname",region="dev",type="NET_TX",zone="3"} 0
huatuo_bamai_softirq_latency{cpuid="1",host="hostname",region="dev",type="NET_RX",zone="0"} 110
huatuo_bamai_softirq_latency{cpuid="1",host="hostname",region="dev",type="NET_RX",zone="1"} 0
huatuo_bamai_softirq_latency{cpuid="1",host="hostname",region="dev",type="NET_RX",zone="2"} 1
huatuo_bamai_softirq_latency{cpuid="1",host="hostname",region="dev",type="NET_RX",zone="3"} 0
huatuo_bamai_softirq_latency{cpuid="1",host="hostname",region="dev",type="NET_TX",zone="0"} 0
huatuo_bamai_softirq_latency{cpuid="1",host="hostname",region="dev",type="NET_TX",zone="1"} 0
huatuo_bamai_softirq_latency{cpuid="1",host="hostname",region="dev",type="NET_TX",zone="2"} 0
| Metric | Description | Unit | Target | Source | Labels |
|---|---|---|---|---|---|
| softirq_latency | SoftIRQ response latency histogram buckets: zone0, 0-10us zone1, 10-100us zone2, 100-1000us zone3, 1+ms |
count | Host | eBPF | cpuid, host, region, type, zone |
Utilization
Metrics showing CPU usage on hosts and containers (Prometheus format):
# HELP huatuo_bamai_cpu_util_sys cpu sys for the host
# TYPE huatuo_bamai_cpu_util_sys gauge
huatuo_bamai_cpu_util_sys{host="hostname",region="dev"} 6.268857848549965e-06
# HELP huatuo_bamai_cpu_util_total cpu total for the host
# TYPE huatuo_bamai_cpu_util_total gauge
huatuo_bamai_cpu_util_total{host="hostname",region="dev"} 1.7736934944144352e-05
# HELP huatuo_bamai_cpu_util_usr cpu usr for the host
# TYPE huatuo_bamai_cpu_util_usr gauge
huatuo_bamai_cpu_util_usr{host="hostname",region="dev"} 1.1468077095594387e-05

# HELP huatuo_bamai_cpu_util_container_sys cpu sys for the containers
# TYPE huatuo_bamai_cpu_util_container_sys gauge
huatuo_bamai_cpu_util_container_sys{container_host="coredns-855c4dd65d-8v5kg",container_hostnamespace="kube-system",container_level="burstable",container_name="coredns",container_type="normal",host="hostname",region="dev"} 1.6708593420881415e-07
# HELP huatuo_bamai_cpu_util_container_total cpu total for the containers
# TYPE huatuo_bamai_cpu_util_container_total gauge
huatuo_bamai_cpu_util_container_total{container_host="coredns-855c4dd65d-8v5kg",container_hostnamespace="kube-system",container_level="burstable",container_name="coredns",container_type="normal",host="hostname",region="dev"} 3.379584661890774e-07
# HELP huatuo_bamai_cpu_util_container_usr cpu usr for the containers
# TYPE huatuo_bamai_cpu_util_container_usr gauge
huatuo_bamai_cpu_util_container_usr{container_host="coredns-855c4dd65d-8v5kg",container_hostnamespace="kube-system",container_level="burstable",container_name="coredns",container_type="normal",host="hostname",region="dev"} 1.7087253017325962e-07
| Metric | Description | Unit | Target | Labels |
|---|---|---|---|---|
| cpu_util_sys | CPU system (kernel) time % | % | Host | host, region |
| cpu_util_usr | CPU user time % | % | Host | host, region |
| cpu_util_total | CPU total utilization % | % | Host | host, region |
| cpu_util_container_sys | Container CPU system time % | % | Container | container_host,container_hostnamespace,container_level,container_name,container_type,host,region |
| cpu_util_container_usr | Container CPU user time % | % | Container | container_host,container_hostnamespace,container_level,container_name,container_type,host,region |
| cpu_util_container_total | Container CPU total % | % | Container | container_host,container_hostnamespace,container_level,container_name,container_type,host,region |
Allocation
Container CPU resource configuration:
# HELP huatuo_bamai_cpu_util_container_cores cpu core number for the containers
# TYPE huatuo_bamai_cpu_util_container_cores gauge
huatuo_bamai_cpu_util_container_cores{container_host="coredns-855c4dd65d-8v5kg",container_hostnamespace="kube-system",container_level="Burstable",container_name="coredns",container_type="Normal",host="hostname",region="dev"} 6
| Metric | Description | Unit | Target | Labels |
|---|---|---|---|---|
| cpu_util_container_cores | Number of CPU cores | cores | Container | (same as above) |
Contention
Metrics reflecting container throttling and contention:
# HELP huatuo_bamai_cpu_stat_container_nr_throttled throttle nr for the containers
# TYPE huatuo_bamai_cpu_stat_container_nr_throttled gauge
huatuo_bamai_cpu_stat_container_nr_throttled{container_host="coredns-855c4dd65d-8v5kg",container_hostnamespace="kube-system",container_level="burstable",container_name="coredns",container_type="normal",host="hostname",region="dev"} 0
# HELP huatuo_bamai_cpu_stat_container_throttled_time throttle time for the containers
# TYPE huatuo_bamai_cpu_stat_container_throttled_time gauge
huatuo_bamai_cpu_stat_container_throttled_time{container_host="coredns-855c4dd65d-8v5kg",container_hostnamespace="kube-system",container_level="burstable",container_name="coredns",container_type="normal",host="hostname",region="dev"} 0
| Metric | Description | Unit | Target | Labels |
|---|---|---|---|---|
| cpu_stat_container_nr_throttled | Number of times the cgroup was throttled | count | Container | container_host, container_hostnamespace, container_level, container_name, container_type, host, region |
| cpu_stat_container_throttled_time | Total time the cgroup was throttled | nanoseconds | Container | container_host, container_hostnamespace, container_level, container_name, container_type, host, region |
Ref:
- https://docs.kernel.org/scheduler/sched-bwc.html#statistics
- https://www.kernel.org/doc/html/latest/admin-guide/cgroup-v2.html#cpu-interface-files
The following metric is available when the kernel exports wait_sum:
# HELP huatuo_bamai_cpu_stat_container_wait_sum_percent percentage of CFS cgroup schedulable time spent waiting on the parent runqueue (requires kernel.sched_schedstats=1)
# TYPE huatuo_bamai_cpu_stat_container_wait_sum_percent gauge
huatuo_bamai_cpu_stat_container_wait_sum_percent{container_host="coredns-855c4dd65d-8v5kg",container_hostnamespace="kube-system",container_level="burstable",container_name="coredns",container_type="normal",host="hostname",region="dev"} 0
Burst Behavior
Metrics showing burst usage beyond quota:
# HELP huatuo_bamai_cpu_stat_container_nr_bursts burst nr for the containers
# TYPE huatuo_bamai_cpu_stat_container_nr_bursts gauge
huatuo_bamai_cpu_stat_container_nr_bursts{container_host="coredns-855c4dd65d-8v5kg",container_hostnamespace="kube-system",container_level="burstable",container_name="coredns",container_type="normal",host="hostname",region="dev"} 0
huatuo_bamai_cpu_stat_container_nr_bursts{container_host="coredns-855c4dd65d-mnpqf",container_hostnamespace="kube-system",container_level="burstable",container_name="coredns",container_type="normal",host="hostname",region="dev"} 0
# HELP huatuo_bamai_cpu_stat_container_burst_time burst time for the containers
# TYPE huatuo_bamai_cpu_stat_container_burst_time gauge
huatuo_bamai_cpu_stat_container_burst_time{container_host="coredns-855c4dd65d-8v5kg",container_hostnamespace="kube-system",container_level="burstable",container_name="coredns",container_type="normal",host="hostname",region="dev"} 0
huatuo_bamai_cpu_stat_container_burst_time{container_host="coredns-855c4dd65d-mnpqf",container_hostnamespace="kube-system",container_level="burstable",container_name="coredns",container_type="normal",host="hostname",region="dev"} 0
| Metric | Description | Unit | Target | Labels |
|---|---|---|---|---|
| cpu_stat_container_burst_time | Cumulative wall-clock time spent above quota across all periods | nanoseconds | Container | container_host, container_hostnamespace, container_level, container_name, container_type, host, region |
| cpu_stat_container_nr_bursts | Number of periods in which usage exceeded quota | count | Container | container_host, container_hostnamespace, container_level, container_name, container_type, host, region |
Load
Load average and runnable/uninterruptible task counts:
# HELP huatuo_bamai_loadavg_load1 system load average, 1 minute
# TYPE huatuo_bamai_loadavg_load1 gauge
huatuo_bamai_loadavg_load1{host="hostname",region="dev"} 0.3
# HELP huatuo_bamai_loadavg_load15 system load average, 15 minutes
# TYPE huatuo_bamai_loadavg_load15 gauge
huatuo_bamai_loadavg_load15{host="hostname",region="dev"} 0.22
# HELP huatuo_bamai_loadavg_load5 system load average, 5 minutes
# TYPE huatuo_bamai_loadavg_load5 gauge
huatuo_bamai_loadavg_load5{host="hostname",region="dev"} 0.2
# HELP huatuo_bamai_loadavg_container_nr_running nr_running of container
# TYPE huatuo_bamai_loadavg_container_nr_running gauge
huatuo_bamai_loadavg_container_nr_running{container_host="coredns-855c4dd65d-8v5kg",container_hostnamespace="kube-system",container_level="burstable",container_name="coredns",container_type="normal",host="hostname",region="dev"} 1
# HELP huatuo_bamai_loadavg_container_nr_uninterruptible nr_uninterruptible of container
# TYPE huatuo_bamai_loadavg_container_nr_uninterruptible gauge
huatuo_bamai_loadavg_container_nr_uninterruptible{container_host="coredns-855c4dd65d-8v5kg",container_hostnamespace="kube-system",container_level="burstable",container_name="coredns",container_type="normal",host="hostname",region="dev"} 0
| Metric | Description | Unit | Target | Labels | |
|---|---|---|---|---|---|
| loadavg_load1 | 1-minute system load average | count | Host | host, region | |
| loadavg_load5 | 5-minute system load average | count | Host | host, region | |
| loadavg_load15 | 15-minute system load average | count | Host | host, region | |
| loadavg_container_container_nr_running | Number of running tasks in container | count | Container | host, region | cgroup v1 only |
| loadavg_container_container_nr_uninterruptible | Number of uninterruptible tasks in container | count | Container | host, region | cgroup v1 only |
Memory System
Reclaim
Metrics showing time spent stalled due to memory reclaim/compaction:
# HELP huatuo_bamai_memory_free_allocpages_stall time stalled in alloc pages
# TYPE huatuo_bamai_memory_free_allocpages_stall gauge
huatuo_bamai_memory_free_allocpages_stall{host="hostname",region="dev"} 0
# HELP huatuo_bamai_memory_free_compaction_stall time stalled in memory compaction
# TYPE huatuo_bamai_memory_free_compaction_stall gauge
huatuo_bamai_memory_free_compaction_stall{host="hostname",region="dev"} 0
# HELP huatuo_bamai_memory_reclaim_container_directstall counter of cgroup reclaim when try_charge
# TYPE huatuo_bamai_memory_reclaim_container_directstall gauge
huatuo_bamai_memory_reclaim_container_directstall{container_host="coredns-855c4dd65d-8v5kg",container_hostnamespace="kube-system",container_level="burstable",container_name="coredns",container_type="normal",host="hostname",region="dev"} 0
| Metric | Description | Unit | Target | Source | Labels |
|---|---|---|---|---|---|
| memory_free_allocpages_stall | Time stalled waiting for page allocation | nanoseconds | Host | eBPF | host, region |
| memory_free_compaction_stall | Time stalled in memory compaction | nanoseconds | Host | eBPF | host, region |
| memory_reclaim_container_directstall | Number of direct reclaim events in container | count | Container | eBPF | container_host, container_hostnamespace, container_level, container_name, container_type, host, region |
Note: The
memory_others_container_directstall_time,memory_others_container_asyncreclaim_time, andmemory_others_container_local_direct_reclaim_timemetrics read memory cgroup extension interfaces provided by the Didi Cloud custom kernel (memory.directstall_stat,memory.asynreclaim_stat,memory.local_direct_reclaim_time). Mainline and common distribution kernels do not expose these interfaces, so these metrics are simply not emitted there — this is expected, and no extra kernel module can provide them. To observe container direct reclaim behavior on standard kernels, use the eBPF-basedmemory_reclaim_container_directstalllisted above.
State
From cgroup memory.stat:
# HELP huatuo_bamai_memory_vmstat_container_active_anon cgroup memory.stat active_anon
# TYPE huatuo_bamai_memory_vmstat_container_active_anon gauge
huatuo_bamai_memory_vmstat_container_active_anon{container_host="coredns-855c4dd65d-8v5kg",container_hostnamespace="kube-system",container_level="burstable",container_name="coredns",container_type="normal",host="hostname",region="dev"} 1.47456e+07
# HELP huatuo_bamai_memory_vmstat_container_active_file cgroup memory.stat active_file
# TYPE huatuo_bamai_memory_vmstat_container_active_file gauge
huatuo_bamai_memory_vmstat_container_active_file{container_host="coredns-855c4dd65d-8v5kg",container_hostnamespace="kube-system",container_level="burstable",container_name="coredns",container_type="normal",host="hostname",region="dev"} 2.3617536e+07
# HELP huatuo_bamai_memory_vmstat_container_file_dirty cgroup memory.stat file_dirty
# TYPE huatuo_bamai_memory_vmstat_container_file_dirty gauge
huatuo_bamai_memory_vmstat_container_file_dirty{container_host="coredns-855c4dd65d-8v5kg",container_hostnamespace="kube-system",container_level="burstable",container_name="coredns",container_type="normal",host="hostname",region="dev"} 0
# HELP huatuo_bamai_memory_vmstat_container_file_writeback cgroup memory.stat file_writeback
# TYPE huatuo_bamai_memory_vmstat_container_file_writeback gauge
huatuo_bamai_memory_vmstat_container_file_writeback{container_host="coredns-855c4dd65d-8v5kg",container_hostnamespace="kube-system",container_level="burstable",container_name="coredns",container_type="normal",host="hostname",region="dev"} 0
# HELP huatuo_bamai_memory_vmstat_container_inactive_anon cgroup memory.stat inactive_anon
# TYPE huatuo_bamai_memory_vmstat_container_inactive_anon gauge
huatuo_bamai_memory_vmstat_container_inactive_anon{container_host="coredns-855c4dd65d-8v5kg",container_hostnamespace="kube-system",container_level="burstable",container_name="coredns",container_type="normal",host="hostname",region="dev"} 0
# HELP huatuo_bamai_memory_vmstat_container_inactive_file cgroup memory.stat inactive_file
# TYPE huatuo_bamai_memory_vmstat_container_inactive_file gauge
huatuo_bamai_memory_vmstat_container_inactive_file{container_host="coredns-855c4dd65d-8v5kg",container_hostnamespace="kube-system",container_level="burstable",container_name="coredns",container_type="normal",host="hostname",region="dev"} 65536
# HELP huatuo_bamai_memory_vmstat_container_pgdeactivate cgroup memory.stat pgdeactivate
# TYPE huatuo_bamai_memory_vmstat_container_pgdeactivate gauge
huatuo_bamai_memory_vmstat_container_pgdeactivate{container_host="coredns-855c4dd65d-8v5kg",container_hostnamespace="kube-system",container_level="burstable",container_name="coredns",container_type="normal",host="hostname",region="dev"} 0
# HELP huatuo_bamai_memory_vmstat_container_pgrefill cgroup memory.stat pgrefill
# TYPE huatuo_bamai_memory_vmstat_container_pgrefill gauge
huatuo_bamai_memory_vmstat_container_pgrefill{container_host="coredns-855c4dd65d-8v5kg",container_hostnamespace="kube-system",container_level="burstable",container_name="coredns",container_type="normal",host="hostname",region="dev"} 0
# HELP huatuo_bamai_memory_vmstat_container_pgscan_direct cgroup memory.stat pgscan_direct
# TYPE huatuo_bamai_memory_vmstat_container_pgscan_direct gauge
huatuo_bamai_memory_vmstat_container_pgscan_direct{container_host="coredns-855c4dd65d-8v5kg",container_hostnamespace="kube-system",container_level="burstable",container_name="coredns",container_type="normal",host="hostname",region="dev"} 0
# HELP huatuo_bamai_memory_vmstat_container_pgscan_kswapd cgroup memory.stat pgscan_kswapd
# TYPE huatuo_bamai_memory_vmstat_container_pgscan_kswapd gauge
huatuo_bamai_memory_vmstat_container_pgscan_kswapd{container_host="coredns-855c4dd65d-8v5kg",container_hostnamespace="kube-system",container_level="burstable",container_name="coredns",container_type="normal",host="hostname",region="dev"} 0
# HELP huatuo_bamai_memory_vmstat_container_pgsteal_direct cgroup memory.stat pgsteal_direct
# TYPE huatuo_bamai_memory_vmstat_container_pgsteal_direct gauge
huatuo_bamai_memory_vmstat_container_pgsteal_direct{container_host="coredns-855c4dd65d-8v5kg",container_hostnamespace="kube-system",container_level="burstable",container_name="coredns",container_type="normal",host="hostname",region="dev"} 0
# HELP huatuo_bamai_memory_vmstat_container_pgsteal_kswapd cgroup memory.stat pgsteal_kswapd
# TYPE huatuo_bamai_memory_vmstat_container_pgsteal_kswapd gauge
huatuo_bamai_memory_vmstat_container_pgsteal_kswapd{container_host="coredns-855c4dd65d-8v5kg",container_hostnamespace="kube-system",container_level="burstable",container_name="coredns",container_type="normal",host="hostname",region="dev"} 0
# HELP huatuo_bamai_memory_vmstat_container_shmem cgroup memory.stat shmem
# TYPE huatuo_bamai_memory_vmstat_container_shmem gauge
huatuo_bamai_memory_vmstat_container_shmem{container_host="coredns-855c4dd65d-8v5kg",container_hostnamespace="kube-system",container_level="burstable",container_name="coredns",container_type="normal",host="hostname",region="dev"} 0
# HELP huatuo_bamai_memory_vmstat_container_shmem_thp cgroup memory.stat shmem_thp
# TYPE huatuo_bamai_memory_vmstat_container_shmem_thp gauge
huatuo_bamai_memory_vmstat_container_shmem_thp{container_host="coredns-855c4dd65d-8v5kg",container_hostnamespace="kube-system",container_level="burstable",container_name="coredns",container_type="normal",host="hostname",region="dev"} 0
# HELP huatuo_bamai_memory_vmstat_container_unevictable cgroup memory.stat unevictable
# TYPE huatuo_bamai_memory_vmstat_container_unevictable gauge
huatuo_bamai_memory_vmstat_container_unevictable{container_host="coredns-855c4dd65d-8v5kg",container_hostnamespace="kube-system",container_level="burstable",container_name="coredns",container_type="normal",host="hostname",region="dev"} 0
| Metric | Description | Unit | Target | Labels |
|---|---|---|---|---|
| memory_vmstat_container_active_file | Active file-backed memory | Bytes | Container | container_host, container_hostnamespace, container_level, container_name, container_type, host, region |
| memory_vmstat_container_active_anon | Active anonymous memory | Bytes | Container | container_host, container_hostnamespace, container_level, container_name, container_type, host, region |
| memory_vmstat_container_inactive_file | Inactive file-backed memory | Bytes | Container | container_host, container_hostnamespace, container_level, container_name, container_type, host, region |
| memory_vmstat_container_inactive_anon | Inactive anonymous memory | Bytes | Container | container_host, container_hostnamespace, container_level, container_name, container_type, host, region |
| memory_vmstat_container_file_dirty | Dirty file pages not yet written back | Bytes | Container | container_host, container_hostnamespace, container_level, container_name, container_type, host, region |
| memory_vmstat_container_file_writeback | File pages currently being written back | Bytes | Container | container_host, container_hostnamespace, container_level, container_name, container_type, host, region |
| memory_vmstat_container_unevictable | Unevictable pages (mlocked, hugetlbfs, etc.) | Bytes | Container | container_host, container_hostnamespace, container_level, container_name, container_type, host, region |
| … (pgscan_direct, pgsteal_kswapd, etc.) | Standard vmstat reclaim / scanning counters | Bytes | Container | container_host, container_hostnamespace, container_level, container_name, container_type, host, region |
Host memory state.
# HELP huatuo_bamai_memory_vmstat_allocstall_device /proc/vmstat allocstall_device
# TYPE huatuo_bamai_memory_vmstat_allocstall_device gauge
huatuo_bamai_memory_vmstat_allocstall_device{host="hostname",region="dev"} 0
# HELP huatuo_bamai_memory_vmstat_allocstall_dma /proc/vmstat allocstall_dma
# TYPE huatuo_bamai_memory_vmstat_allocstall_dma gauge
huatuo_bamai_memory_vmstat_allocstall_dma{host="hostname",region="dev"} 0
# HELP huatuo_bamai_memory_vmstat_allocstall_dma32 /proc/vmstat allocstall_dma32
# TYPE huatuo_bamai_memory_vmstat_allocstall_dma32 gauge
huatuo_bamai_memory_vmstat_allocstall_dma32{host="hostname",region="dev"} 0
# HELP huatuo_bamai_memory_vmstat_allocstall_movable /proc/vmstat allocstall_movable
# TYPE huatuo_bamai_memory_vmstat_allocstall_movable gauge
huatuo_bamai_memory_vmstat_allocstall_movable{host="hostname",region="dev"} 0
# HELP huatuo_bamai_memory_vmstat_allocstall_normal /proc/vmstat allocstall_normal
# TYPE huatuo_bamai_memory_vmstat_allocstall_normal gauge
huatuo_bamai_memory_vmstat_allocstall_normal{host="hostname",region="dev"} 0
# HELP huatuo_bamai_memory_vmstat_nr_active_anon /proc/vmstat nr_active_anon
# TYPE huatuo_bamai_memory_vmstat_nr_active_anon gauge
huatuo_bamai_memory_vmstat_nr_active_anon{host="hostname",region="dev"} 155449
# HELP huatuo_bamai_memory_vmstat_nr_active_file /proc/vmstat nr_active_file
# TYPE huatuo_bamai_memory_vmstat_nr_active_file gauge
huatuo_bamai_memory_vmstat_nr_active_file{host="hostname",region="dev"} 212425
# HELP huatuo_bamai_memory_vmstat_nr_dirty /proc/vmstat nr_dirty
# TYPE huatuo_bamai_memory_vmstat_nr_dirty gauge
huatuo_bamai_memory_vmstat_nr_dirty{host="hostname",region="dev"} 19047
# HELP huatuo_bamai_memory_vmstat_nr_dirty_background_threshold /proc/vmstat nr_dirty_background_threshold
# TYPE huatuo_bamai_memory_vmstat_nr_dirty_background_threshold gauge
huatuo_bamai_memory_vmstat_nr_dirty_background_threshold{host="hostname",region="dev"} 379858
# HELP huatuo_bamai_memory_vmstat_nr_dirty_threshold /proc/vmstat nr_dirty_threshold
# TYPE huatuo_bamai_memory_vmstat_nr_dirty_threshold gauge
huatuo_bamai_memory_vmstat_nr_dirty_threshold{host="hostname",region="dev"} 760646
# HELP huatuo_bamai_memory_vmstat_nr_free_pages /proc/vmstat nr_free_pages
# TYPE huatuo_bamai_memory_vmstat_nr_free_pages gauge
huatuo_bamai_memory_vmstat_nr_free_pages{host="hostname",region="dev"} 3.20535e+06
# HELP huatuo_bamai_memory_vmstat_nr_inactive_anon /proc/vmstat nr_inactive_anon
# TYPE huatuo_bamai_memory_vmstat_nr_inactive_anon gauge
huatuo_bamai_memory_vmstat_nr_inactive_anon{host="hostname",region="dev"} 0
# HELP huatuo_bamai_memory_vmstat_nr_inactive_file /proc/vmstat nr_inactive_file
# TYPE huatuo_bamai_memory_vmstat_nr_inactive_file gauge
huatuo_bamai_memory_vmstat_nr_inactive_file{host="hostname",region="dev"} 428518
# HELP huatuo_bamai_memory_vmstat_nr_mlock /proc/vmstat nr_mlock
# TYPE huatuo_bamai_memory_vmstat_nr_mlock gauge
huatuo_bamai_memory_vmstat_nr_mlock{host="hostname",region="dev"} 6821
# HELP huatuo_bamai_memory_vmstat_nr_shmem /proc/vmstat nr_shmem
# TYPE huatuo_bamai_memory_vmstat_nr_shmem gauge
huatuo_bamai_memory_vmstat_nr_shmem{host="hostname",region="dev"} 541
# HELP huatuo_bamai_memory_vmstat_nr_shmem_hugepages /proc/vmstat nr_shmem_hugepages
# TYPE huatuo_bamai_memory_vmstat_nr_shmem_hugepages gauge
huatuo_bamai_memory_vmstat_nr_shmem_hugepages{host="hostname",region="dev"} 0
# HELP huatuo_bamai_memory_vmstat_nr_shmem_pmdmapped /proc/vmstat nr_shmem_pmdmapped
# TYPE huatuo_bamai_memory_vmstat_nr_shmem_pmdmapped gauge
huatuo_bamai_memory_vmstat_nr_shmem_pmdmapped{host="hostname",region="dev"} 0
# HELP huatuo_bamai_memory_vmstat_nr_slab_reclaimable /proc/vmstat nr_slab_reclaimable
# TYPE huatuo_bamai_memory_vmstat_nr_slab_reclaimable gauge
huatuo_bamai_memory_vmstat_nr_slab_reclaimable{host="hostname",region="dev"} 22322
# HELP huatuo_bamai_memory_vmstat_nr_slab_unreclaimable /proc/vmstat nr_slab_unreclaimable
# TYPE huatuo_bamai_memory_vmstat_nr_slab_unreclaimable gauge
huatuo_bamai_memory_vmstat_nr_slab_unreclaimable{host="hostname",region="dev"} 24168
# HELP huatuo_bamai_memory_vmstat_nr_unevictable /proc/vmstat nr_unevictable
# TYPE huatuo_bamai_memory_vmstat_nr_unevictable gauge
huatuo_bamai_memory_vmstat_nr_unevictable{host="hostname",region="dev"} 6839
# HELP huatuo_bamai_memory_vmstat_nr_writeback /proc/vmstat nr_writeback
# TYPE huatuo_bamai_memory_vmstat_nr_writeback gauge
huatuo_bamai_memory_vmstat_nr_writeback{host="hostname",region="dev"} 0
# HELP huatuo_bamai_memory_vmstat_nr_writeback_temp /proc/vmstat nr_writeback_temp
# TYPE huatuo_bamai_memory_vmstat_nr_writeback_temp gauge
huatuo_bamai_memory_vmstat_nr_writeback_temp{host="hostname",region="dev"} 0
# HELP huatuo_bamai_memory_vmstat_numa_pages_migrated /proc/vmstat numa_pages_migrated
# TYPE huatuo_bamai_memory_vmstat_numa_pages_migrated gauge
huatuo_bamai_memory_vmstat_numa_pages_migrated{host="hostname",region="dev"} 0
# HELP huatuo_bamai_memory_vmstat_pgdeactivate /proc/vmstat pgdeactivate
# TYPE huatuo_bamai_memory_vmstat_pgdeactivate gauge
huatuo_bamai_memory_vmstat_pgdeactivate{host="hostname",region="dev"} 0
# HELP huatuo_bamai_memory_vmstat_pgrefill /proc/vmstat pgrefill
# TYPE huatuo_bamai_memory_vmstat_pgrefill gauge
huatuo_bamai_memory_vmstat_pgrefill{host="hostname",region="dev"} 0
# HELP huatuo_bamai_memory_vmstat_pgscan_direct /proc/vmstat pgscan_direct
# TYPE huatuo_bamai_memory_vmstat_pgscan_direct gauge
huatuo_bamai_memory_vmstat_pgscan_direct{host="hostname",region="dev"} 0
# HELP huatuo_bamai_memory_vmstat_pgscan_direct_throttle /proc/vmstat pgscan_direct_throttle
# TYPE huatuo_bamai_memory_vmstat_pgscan_direct_throttle gauge
huatuo_bamai_memory_vmstat_pgscan_direct_throttle{host="hostname",region="dev"} 0
# HELP huatuo_bamai_memory_vmstat_pgscan_kswapd /proc/vmstat pgscan_kswapd
# TYPE huatuo_bamai_memory_vmstat_pgscan_kswapd gauge
huatuo_bamai_memory_vmstat_pgscan_kswapd{host="hostname",region="dev"} 0
# HELP huatuo_bamai_memory_vmstat_pgsteal_direct /proc/vmstat pgsteal_direct
# TYPE huatuo_bamai_memory_vmstat_pgsteal_direct gauge
huatuo_bamai_memory_vmstat_pgsteal_direct{host="hostname",region="dev"} 0
# HELP huatuo_bamai_memory_vmstat_pgsteal_kswapd /proc/vmstat pgsteal_kswapd
# TYPE huatuo_bamai_memory_vmstat_pgsteal_kswapd gauge
huatuo_bamai_memory_vmstat_pgsteal_kswapd{host="hostname",region="dev"} 0
Standard kernel vmstat counters (see kernel documentation for full details):
- nr_free_pages: total free pages in buddy allocator
- nr_active_anon / nr_inactive_anon: active / inactive anonymous pages
- nr_active_file / nr_inactive_file: active / inactive file pages
- nr_dirty / nr_writeback: dirty / under writeback pages
- nr_dirty_threshold / nr_dirty_background_threshold: dirty page writeback thresholds
- pgscan_kswapd / pgsteal_kswapd / … : reclaim & scanning statistics
- allocstall_*: stalls due to allocation failure in different zones
- numa_hit / numa_miss / numa_foreign / numa_local / numa_other: NUMA allocation statistics
Ref:
- https://docs.kernel.org/admin-guide/cgroup-v2.html
- https://docs.kernel.org/admin-guide/cgroup-v1/memory.html
- https://docs.kernel.org/admin-guide/mm/transhuge.html
Events
From memory.events:
# HELP huatuo_bamai_memory_events_container_high memory events high
# TYPE huatuo_bamai_memory_events_container_high gauge
huatuo_bamai_memory_events_container_high{container_host="coredns-855c4dd65d-8v5kg",container_hostnamespace="kube-system",container_level="burstable",container_name="coredns",container_type="normal",host="hostname",region="dev"} 0
# HELP huatuo_bamai_memory_events_container_low memory events low
# TYPE huatuo_bamai_memory_events_container_low gauge
huatuo_bamai_memory_events_container_low{container_host="coredns-855c4dd65d-8v5kg",container_hostnamespace="kube-system",container_level="burstable",container_name="coredns",container_type="normal",host="hostname",region="dev"} 0
# HELP huatuo_bamai_memory_events_container_max memory events max
# TYPE huatuo_bamai_memory_events_container_max gauge
huatuo_bamai_memory_events_container_max{container_host="coredns-855c4dd65d-8v5kg",container_hostnamespace="kube-system",container_level="burstable",container_name="coredns",container_type="normal",host="hostname",region="dev"} 0
# HELP huatuo_bamai_memory_events_container_oom memory events oom
# TYPE huatuo_bamai_memory_events_container_oom gauge
huatuo_bamai_memory_events_container_oom{container_host="coredns-855c4dd65d-8v5kg",container_hostnamespace="kube-system",container_level="burstable",container_name="coredns",container_type="normal",host="hostname",region="dev"} 0
# HELP huatuo_bamai_memory_events_container_oom_group_kill memory events oom_group_kill
# TYPE huatuo_bamai_memory_events_container_oom_group_kill gauge
huatuo_bamai_memory_events_container_oom_group_kill{container_host="coredns-855c4dd65d-8v5kg",container_hostnamespace="kube-system",container_level="burstable",container_name="coredns",container_type="normal",host="hostname",region="dev"} 0
# HELP huatuo_bamai_memory_events_container_oom_kill memory events oom_kill
# TYPE huatuo_bamai_memory_events_container_oom_kill gauge
huatuo_bamai_memory_events_container_oom_kill{container_host="coredns-855c4dd65d-8v5kg",container_hostnamespace="kube-system",container_level="burstable",container_name="coredns",container_type="normal",host="hostname",region="dev"} 0
| Metric | Description | Unit | Target | Labels |
|---|---|---|---|---|
| memory_events_container_low | Pages reclaimed below memory.low due to system pressure | count | Container | container_host, container_hostnamespace, container_level, container_name, container_type, host, region |
| memory_events_container_high | Times usage exceeded memory.high (throttling / direct reclaim triggered) | count | Container | container_host, container_hostnamespace, container_level, container_name, container_type, host, region |
| memory_events_container_max | Times approaching or hitting memory.max | count | Container | container_host, container_hostnamespace, container_level, container_name, container_type, host, region |
| memory_events_container_oom | Times OOM path entered due to memory.max | count | Container | container_host, container_hostnamespace, container_level, container_name, container_type, host, region |
| memory_events_container_oom_kill | Number of processes killed by OOM killer in cgroup | count | Container | container_host, container_hostnamespace, container_level, container_name, container_type, host, region |
| memory_events_container_oom_group_kill | Number of times entire cgroup killed by OOM | count | Container | container_host, container_hostnamespace, container_level, container_name, container_type, host, region |
Buddyinfo
Free page block distribution per node/zone/order (from /proc/buddyinfo):
# HELP huatuo_bamai_memory_buddyinfo_blocks buddy info
# TYPE huatuo_bamai_memory_buddyinfo_blocks gauge
huatuo_bamai_memory_buddyinfo_blocks{host="hostname",node="0",order="0",region="dev",zone="DMA"} 0
huatuo_bamai_memory_buddyinfo_blocks{host="hostname",node="0",order="0",region="dev",zone="DMA32"} 3
huatuo_bamai_memory_buddyinfo_blocks{host="hostname",node="0",order="0",region="dev",zone="Normal"} 7
huatuo_bamai_memory_buddyinfo_blocks{host="hostname",node="0",order="1",region="dev",zone="DMA"} 0
huatuo_bamai_memory_buddyinfo_blocks{host="hostname",node="0",order="1",region="dev",zone="DMA32"} 1
huatuo_bamai_memory_buddyinfo_blocks{host="hostname",node="0",order="1",region="dev",zone="Normal"} 36
huatuo_bamai_memory_buddyinfo_blocks{host="hostname",node="0",order="10",region="dev",zone="DMA"} 2
huatuo_bamai_memory_buddyinfo_blocks{host="hostname",node="0",order="10",region="dev",zone="DMA32"} 743
huatuo_bamai_memory_buddyinfo_blocks{host="hostname",node="0",order="10",region="dev",zone="Normal"} 2265
huatuo_bamai_memory_buddyinfo_blocks{host="hostname",node="0",order="2",region="dev",zone="DMA"} 0
huatuo_bamai_memory_buddyinfo_blocks{host="hostname",node="0",order="2",region="dev",zone="DMA32"} 3
huatuo_bamai_memory_buddyinfo_blocks{host="hostname",node="0",order="2",region="dev",zone="Normal"} 10
huatuo_bamai_memory_buddyinfo_blocks{host="hostname",node="0",order="3",region="dev",zone="DMA"} 0
huatuo_bamai_memory_buddyinfo_blocks{host="hostname",node="0",order="3",region="dev",zone="DMA32"} 2
huatuo_bamai_memory_buddyinfo_blocks{host="hostname",node="0",order="3",region="dev",zone="Normal"} 224
huatuo_bamai_memory_buddyinfo_blocks{host="hostname",node="0",order="4",region="dev",zone="DMA"} 0
huatuo_bamai_memory_buddyinfo_blocks{host="hostname",node="0",order="4",region="dev",zone="DMA32"} 1
huatuo_bamai_memory_buddyinfo_blocks{host="hostname",node="0",order="4",region="dev",zone="Normal"} 376
huatuo_bamai_memory_buddyinfo_blocks{host="hostname",node="0",order="5",region="dev",zone="DMA"} 0
huatuo_bamai_memory_buddyinfo_blocks{host="hostname",node="0",order="5",region="dev",zone="DMA32"} 1
huatuo_bamai_memory_buddyinfo_blocks{host="hostname",node="0",order="5",region="dev",zone="Normal"} 165
huatuo_bamai_memory_buddyinfo_blocks{host="hostname",node="0",order="6",region="dev",zone="DMA"} 0
huatuo_bamai_memory_buddyinfo_blocks{host="hostname",node="0",order="6",region="dev",zone="DMA32"} 3
huatuo_bamai_memory_buddyinfo_blocks{host="hostname",node="0",order="6",region="dev",zone="Normal"} 118
huatuo_bamai_memory_buddyinfo_blocks{host="hostname",node="0",order="7",region="dev",zone="DMA"} 0
huatuo_bamai_memory_buddyinfo_blocks{host="hostname",node="0",order="7",region="dev",zone="DMA32"} 4
huatuo_bamai_memory_buddyinfo_blocks{host="hostname",node="0",order="7",region="dev",zone="Normal"} 172
huatuo_bamai_memory_buddyinfo_blocks{host="hostname",node="0",order="8",region="dev",zone="DMA"} 1
huatuo_bamai_memory_buddyinfo_blocks{host="hostname",node="0",order="8",region="dev",zone="DMA32"} 4
huatuo_bamai_memory_buddyinfo_blocks{host="hostname",node="0",order="8",region="dev",zone="Normal"} 35
huatuo_bamai_memory_buddyinfo_blocks{host="hostname",node="0",order="9",region="dev",zone="DMA"} 2
huatuo_bamai_memory_buddyinfo_blocks{host="hostname",node="0",order="9",region="dev",zone="DMA32"} 4
huatuo_bamai_memory_buddyinfo_blocks{host="hostname",node="0",order="9",region="dev",zone="Normal"} 25
| Metric | Description | Unit | Target | Labels |
|---|---|---|---|---|
| memory_buddyinfo_blocks | Shows number of free blocks of each order (2^order pages) in each zone. | count | Host | procfs |
Network
ARP
# HELP huatuo_bamai_arp_container_entries arp entries in container netns
# TYPE huatuo_bamai_arp_container_entries gauge
huatuo_bamai_arp_container_entries{container_host="coredns-855c4dd65d-8v5kg",container_hostnamespace="kube-system",container_level="burstable",container_name="coredns",container_type="normal",host="hostname",region="dev"} 1
# HELP huatuo_bamai_arp_entries host init namespace
# TYPE huatuo_bamai_arp_entries gauge
huatuo_bamai_arp_entries{host="hostname",region="dev"} 5
# HELP huatuo_bamai_arp_total all entries in arp_cache for containers and host netns
# TYPE huatuo_bamai_arp_total gauge
huatuo_bamai_arp_total{host="hostname",region="dev"} 12
| Metric | Description | Unit | Scope | Labels |
|---|---|---|---|---|
| arp_entries | Number of ARP entries in the host’s network namespace | count | Host namespace | host, region |
| arp_total | Total number of ARP entries across all network namespaces on the host | count | Host | host, region |
| arp_container_entries | Number of ARP entries in the container’s network namespace | count | Container | container_host, container_hostnamespace, container_level, container_name, container_type, host, region |
Qdisc
Qdisc (Queueing Discipline) is a key module in the Linux kernel networking subsystem. Monitoring this module provides clear visibility into network packet processing and latency behavior.
# HELP huatuo_bamai_netdev_qdisc_backlog Number of bytes currently in queue to be sent.
# TYPE huatuo_bamai_netdev_qdisc_backlog gauge
huatuo_bamai_netdev_qdisc_backlog{device="ens2",host="hostname",kind="fq_codel",region="dev"} 0
# HELP huatuo_bamai_netdev_qdisc_bytes_total Number of bytes sent.
# TYPE huatuo_bamai_netdev_qdisc_bytes_total counter
huatuo_bamai_netdev_qdisc_bytes_total{device="ens2",host="hostname",kind="fq_codel",region="dev"} 2.578235443e+09
# HELP huatuo_bamai_netdev_qdisc_current_queue_length Number of packets currently in queue to be sent.
# TYPE huatuo_bamai_netdev_qdisc_current_queue_length gauge
huatuo_bamai_netdev_qdisc_current_queue_length{device="ens2",host="hostname",kind="fq_codel",region="dev"} 0
# HELP huatuo_bamai_netdev_qdisc_drops_total Number of packet drops.
# TYPE huatuo_bamai_netdev_qdisc_drops_total counter
huatuo_bamai_netdev_qdisc_drops_total{device="ens2",host="hostname",kind="fq_codel",region="dev"} 0
# HELP huatuo_bamai_netdev_qdisc_overlimits_total Number of packet overlimits.
# TYPE huatuo_bamai_netdev_qdisc_overlimits_total counter
huatuo_bamai_netdev_qdisc_overlimits_total{device="ens2",host="hostname",kind="fq_codel",region="dev"} 0
# HELP huatuo_bamai_netdev_qdisc_packets_total Number of packets sent.
# TYPE huatuo_bamai_netdev_qdisc_packets_total counter
huatuo_bamai_netdev_qdisc_packets_total{device="ens2",host="hostname",kind="fq_codel",region="dev"} 6.867714e+06
# HELP huatuo_bamai_netdev_qdisc_requeues_total Number of packets dequeued, not transmitted, and requeued.
# TYPE huatuo_bamai_netdev_qdisc_requeues_total counter
huatuo_bamai_netdev_qdisc_requeues_total{device="ens2",host="hostname",kind="fq_codel",region="dev"} 0
| Metric | Description | Unit | Scope | Labels |
|---|---|---|---|---|
| qdisc_backlog | Bytes of packets currently queued for transmission (backlog) | Bytes | Host | device, host, kind, region |
| qdisc_current_queue_length | Number of packets currently queued | count | Host | device, host, kind, region |
| qdisc_overlimits_total | Total number of times the queue limit was exceeded | count | Host | device, host, kind, region |
| qdisc_requeues_total | Number of times packets were requeued due to temporary inability of the NIC/driver to transmit | count | Host | device, host, kind, region |
| qdisc_drops_total | Total number of packets actively dropped | count | Host | device, host, kind, region |
| qdisc_bytes_total | Total bytes transmitted | Bytes | Host | device, host, kind, region |
| qdisc_packets_total | Total number of packets transmitted | count | Host | device, host, kind, region |
Hardware
This metric tracks packets dropped by the network interface card (NIC) hardware in the receive (RX) path, typically due to buffer overflow, CRC errors, or other hardware-level issues.
# HELP huatuo_bamai_netdev_hw_rx_dropped count of packets dropped at hardware level
# TYPE huatuo_bamai_netdev_hw_rx_dropped gauge
huatuo_bamai_netdev_hw_rx_dropped{device="eth0",driver="mlx5_core",host="hostname",region="dev"} 0
| Metric | Description | Unit | Scope | Labels |
|---|---|---|---|---|
| netdev_hw_rx_dropped | Number of packets dropped by NIC hardware in the receive direction | count | Host | eBPF |
Netdev
# HELP huatuo_bamai_netdev_container_receive_bytes_total Network device statistic receive_bytes.
# TYPE huatuo_bamai_netdev_container_receive_bytes_total counter
huatuo_bamai_netdev_container_receive_bytes_total{container_host="coredns-855c4dd65d-8v5kg",container_hostnamespace="kube-system",container_level="burstable",container_name="coredns",container_type="normal",device="eth0",host="hostname",region="dev"} 6.4400018e+07
# HELP huatuo_bamai_netdev_container_receive_compressed_total Network device statistic receive_compressed.
# TYPE huatuo_bamai_netdev_container_receive_compressed_total counter
huatuo_bamai_netdev_container_receive_compressed_total{container_host="coredns-855c4dd65d-8v5kg",container_hostnamespace="kube-system",container_level="burstable",container_name="coredns",container_type="normal",device="eth0",host="hostname",region="dev"} 0
# HELP huatuo_bamai_netdev_container_receive_dropped_total Network device statistic receive_dropped.
# TYPE huatuo_bamai_netdev_container_receive_dropped_total counter
huatuo_bamai_netdev_container_receive_dropped_total{container_host="coredns-855c4dd65d-8v5kg",container_hostnamespace="kube-system",container_level="burstable",container_name="coredns",container_type="normal",device="eth0",host="hostname",region="dev"} 0
# HELP huatuo_bamai_netdev_container_receive_errors_total Network device statistic receive_errors.
# TYPE huatuo_bamai_netdev_container_receive_errors_total counter
huatuo_bamai_netdev_container_receive_errors_total{container_host="coredns-855c4dd65d-8v5kg",container_hostnamespace="kube-system",container_level="burstable",container_name="coredns",container_type="normal",device="eth0",host="hostname",region="dev"} 0
# HELP huatuo_bamai_netdev_container_receive_fifo_total Network device statistic receive_fifo.
# TYPE huatuo_bamai_netdev_container_receive_fifo_total counter
huatuo_bamai_netdev_container_receive_fifo_total{container_host="coredns-855c4dd65d-8v5kg",container_hostnamespace="kube-system",container_level="burstable",container_name="coredns",container_type="normal",device="eth0",host="hostname",region="dev"} 0
# HELP huatuo_bamai_netdev_container_receive_frame_total Network device statistic receive_frame.
# TYPE huatuo_bamai_netdev_container_receive_frame_total counter
huatuo_bamai_netdev_container_receive_frame_total{container_host="coredns-855c4dd65d-8v5kg",container_hostnamespace="kube-system",container_level="burstable",container_name="coredns",container_type="normal",device="eth0",host="hostname",region="dev"} 0
# HELP huatuo_bamai_netdev_container_receive_multicast_total Network device statistic receive_multicast.
# TYPE huatuo_bamai_netdev_container_receive_multicast_total counter
huatuo_bamai_netdev_container_receive_multicast_total{container_host="coredns-855c4dd65d-8v5kg",container_hostnamespace="kube-system",container_level="burstable",container_name="coredns",container_type="normal",device="eth0",host="hostname",region="dev"} 0
# HELP huatuo_bamai_netdev_container_receive_packets_total Network device statistic receive_packets.
# TYPE huatuo_bamai_netdev_container_receive_packets_total counter
huatuo_bamai_netdev_container_receive_packets_total{container_host="coredns-855c4dd65d-8v5kg",container_hostnamespace="kube-system",container_level="burstable",container_name="coredns",container_type="normal",device="eth0",host="hostname",region="dev"} 693155
# HELP huatuo_bamai_netdev_container_transmit_bytes_total Network device statistic transmit_bytes.
# TYPE huatuo_bamai_netdev_container_transmit_bytes_total counter
huatuo_bamai_netdev_container_transmit_bytes_total{container_host="coredns-855c4dd65d-8v5kg",container_hostnamespace="kube-system",container_level="burstable",container_name="coredns",container_type="normal",device="eth0",host="hostname",region="dev"} 6.2347911e+07
# HELP huatuo_bamai_netdev_container_transmit_carrier_total Network device statistic transmit_carrier.
# TYPE huatuo_bamai_netdev_container_transmit_carrier_total counter
huatuo_bamai_netdev_container_transmit_carrier_total{container_host="coredns-855c4dd65d-8v5kg",container_hostnamespace="kube-system",container_level="burstable",container_name="coredns",container_type="normal",device="eth0",host="hostname",region="dev"} 0
# HELP huatuo_bamai_netdev_container_transmit_colls_total Network device statistic transmit_colls.
# TYPE huatuo_bamai_netdev_container_transmit_colls_total counter
huatuo_bamai_netdev_container_transmit_colls_total{container_host="coredns-855c4dd65d-8v5kg",container_hostnamespace="kube-system",container_level="burstable",container_name="coredns",container_type="normal",device="eth0",host="hostname",region="dev"} 0
# HELP huatuo_bamai_netdev_container_transmit_compressed_total Network device statistic transmit_compressed.
# TYPE huatuo_bamai_netdev_container_transmit_compressed_total counter
huatuo_bamai_netdev_container_transmit_compressed_total{container_host="coredns-855c4dd65d-8v5kg",container_hostnamespace="kube-system",container_level="burstable",container_name="coredns",container_type="normal",device="eth0",host="hostname",region="dev"} 0
# HELP huatuo_bamai_netdev_container_transmit_dropped_total Network device statistic transmit_dropped.
# TYPE huatuo_bamai_netdev_container_transmit_dropped_total counter
huatuo_bamai_netdev_container_transmit_dropped_total{container_host="coredns-855c4dd65d-8v5kg",container_hostnamespace="kube-system",container_level="burstable",container_name="coredns",container_type="normal",device="eth0",host="hostname",region="dev"} 0
# HELP huatuo_bamai_netdev_container_transmit_errors_total Network device statistic transmit_errors.
# TYPE huatuo_bamai_netdev_container_transmit_errors_total counter
huatuo_bamai_netdev_container_transmit_errors_total{container_host="coredns-855c4dd65d-8v5kg",container_hostnamespace="kube-system",container_level="burstable",container_name="coredns",container_type="normal",device="eth0",host="hostname",region="dev"} 0
# HELP huatuo_bamai_netdev_container_transmit_fifo_total Network device statistic transmit_fifo.
# TYPE huatuo_bamai_netdev_container_transmit_fifo_total counter
huatuo_bamai_netdev_container_transmit_fifo_total{container_host="coredns-855c4dd65d-8v5kg",container_hostnamespace="kube-system",container_level="burstable",container_name="coredns",container_type="normal",device="eth0",host="hostname",region="dev"} 0
# HELP huatuo_bamai_netdev_container_transmit_packets_total Network device statistic transmit_packets.
# TYPE huatuo_bamai_netdev_container_transmit_packets_total counter
huatuo_bamai_netdev_container_transmit_packets_total{container_host="coredns-855c4dd65d-8v5kg",container_hostnamespace="kube-system",container_level="burstable",container_name="coredns",container_type="normal",device="eth0",host="hostname",region="dev"} 660218
| Metric | Description | Unit | Scope | Labels |
|---|---|---|---|---|
| netdev_receive_bytes_total | Total number of bytes successfully received | count | Host, Container | container_host, container_hostnamespace, container_level, container_name, container_type, host, region |
| netdev_receive_packets_total | Total number of packets successfully received | count | Host, Container | container_host, container_hostnamespace, container_level, container_name, container_type, host, region |
| netdev_receive_compressed_total | Number of compressed packets received | count | Host, Container | container_host, container_hostnamespace, container_level, container_name, container_type, host, region |
| netdev_receive_frame_total | Number of frame alignment errors on receive | count | Host, Container | container_host, container_hostnamespace, container_level, container_name, container_type, host, region |
| netdev_receive_errors_total | Total number of receive errors | count | Host, Container | container_host, container_hostnamespace, container_level, container_name, container_type, host, region |
| netdev_receive_dropped_total | Number of received packets dropped by kernel or driver (various reasons) | count | Host, Container | container_host, container_hostnamespace, container_level, container_name, container_type, host, region |
| netdev_receive_fifo_total | Number of receive FIFO/ring buffer overflow errors | count | Host, Container | container_host, container_hostnamespace, container_level, container_name, container_type, host, region |
| netdev_transmit_bytes_total | Total number of bytes successfully transmitted | count | Host, Container | container_host, container_hostnamespace, container_level, container_name, container_type, host, region |
| netdev_transmit_packets_total | Total number of packets successfully transmitted | count | Host, Container | container_host, container_hostnamespace, container_level, container_name, container_type, host, region |
| netdev_transmit_errors_total | Total number of transmit errors | count | Host, Container | container_host, container_hostnamespace, container_level, container_name, container_type, host, region |
| netdev_transmit_dropped_total | Number of packets dropped during transmission (queue full, policy, etc.) | count | Host, Container | container_host, container_hostnamespace, container_level, container_name, container_type, host, region |
| netdev_transmit_fifo_total | Number of transmit FIFO/ring buffer errors | count | Host, Container | container_host, container_hostnamespace, container_level, container_name, container_type, host, region |
| netdev_transmit_carrier_total | Number of carrier errors (link down or cable issues during transmission) | count | Host, Container | container_host, container_hostnamespace, container_level, container_name, container_type, host, region |
| netdev_transmit_compressed_total | Number of compressed packets transmitted | count | Host, Container | container_host, container_hostnamespace, container_level, container_name, container_type, host, region |
Tcp Memory
From /proc/net/netstat
# HELP huatuo_bamai_tcp_memory_limit_pages tcp memory pages limit
# TYPE huatuo_bamai_tcp_memory_limit_pages gauge
huatuo_bamai_tcp_memory_limit_pages{host="hostname",region="dev"} 380526
# HELP huatuo_bamai_tcp_memory_usage_bytes tcp memory bytes usage
# TYPE huatuo_bamai_tcp_memory_usage_bytes gauge
huatuo_bamai_tcp_memory_usage_bytes{host="hostname",region="dev"} 0
# HELP huatuo_bamai_tcp_memory_usage_pages tcp memory pages usage
# TYPE huatuo_bamai_tcp_memory_usage_pages gauge
huatuo_bamai_tcp_memory_usage_pages{host="hostname",region="dev"} 0
# HELP huatuo_bamai_tcp_memory_usage_percent tcp memory usage percent
# TYPE huatuo_bamai_tcp_memory_usage_percent gauge
huatuo_bamai_tcp_memory_usage_percent{host="hostname",region="dev"} 0
TcpExt
Linux-specific TCP extended statistics (see kernel Documentation/networking/snmp_counter.rst):
- TcpExtListenDrops / ListenOverflows: drops due to full listen queue
- TcpExtSyncookiesSent / Recv / Failed: SYN cookies handling
- TcpExtTCPRcvCoalesce: packets coalesced in receive path
- TcpExtTCPAutoCorking: packets corked automatically
- TcpExtTCPOrigDataSent: original data bytes sent (excluding retransmits)
- TcpExtTCPLossProbes / TCPLossProbeRecovery: tail loss probe statistics
- TcpExtTCPAbortOn*: various abort reasons
- … (many more – refer to kernel snmp_counter documentation for complete list)
# HELP huatuo_bamai_netstat_container_TcpExt_ArpFilter statistic TcpExtArpFilter.
# TYPE huatuo_bamai_netstat_container_TcpExt_ArpFilter gauge
huatuo_bamai_netstat_container_TcpExt_ArpFilter{container_host="coredns-855c4dd65d-8v5kg",container_hostnamespace="kube-system",container_level="burstable",container_name="coredns",container_type="normal",host="hostname",region="dev"} 0
# HELP huatuo_bamai_netstat_container_TcpExt_BusyPollRxPackets statistic TcpExtBusyPollRxPackets.
# TYPE huatuo_bamai_netstat_container_TcpExt_BusyPollRxPackets gauge
huatuo_bamai_netstat_container_TcpExt_BusyPollRxPackets{container_host="coredns-855c4dd65d-8v5kg",container_hostnamespace="kube-system",container_level="burstable",container_name="coredns",container_type="normal",host="hostname",region="dev"} 0
# HELP huatuo_bamai_netstat_container_TcpExt_DelayedACKLocked statistic TcpExtDelayedACKLocked.
# TYPE huatuo_bamai_netstat_container_TcpExt_DelayedACKLocked gauge
huatuo_bamai_netstat_container_TcpExt_DelayedACKLocked{container_host="coredns-855c4dd65d-8v5kg",container_hostnamespace="kube-system",container_level="burstable",container_name="coredns",container_type="normal",host="hostname",region="dev"} 0
# HELP huatuo_bamai_netstat_container_TcpExt_DelayedACKLost statistic TcpExtDelayedACKLost.
# TYPE huatuo_bamai_netstat_container_TcpExt_DelayedACKLost gauge
huatuo_bamai_netstat_container_TcpExt_DelayedACKLost{container_host="coredns-855c4dd65d-8v5kg",container_hostnamespace="kube-system",container_level="burstable",container_name="coredns",container_type="normal",host="hostname",region="dev"} 0
# HELP huatuo_bamai_netstat_container_TcpExt_DelayedACKs statistic TcpExtDelayedACKs.
# TYPE huatuo_bamai_netstat_container_TcpExt_DelayedACKs gauge
huatuo_bamai_netstat_container_TcpExt_DelayedACKs{container_host="coredns-855c4dd65d-8v5kg",container_hostnamespace="kube-system",container_level="burstable",container_name="coredns",container_type="normal",host="hostname",region="dev"} 4650
# HELP huatuo_bamai_netstat_container_TcpExt_EmbryonicRsts statistic TcpExtEmbryonicRsts.
# TYPE huatuo_bamai_netstat_container_TcpExt_EmbryonicRsts gauge
huatuo_bamai_netstat_container_TcpExt_EmbryonicRsts{container_host="coredns-855c4dd65d-8v5kg",container_hostnamespace="kube-system",container_level="burstable",container_name="coredns",container_type="normal",host="hostname",region="dev"} 0
# HELP huatuo_bamai_netstat_container_TcpExt_IPReversePathFilter statistic TcpExtIPReversePathFilter.
# TYPE huatuo_bamai_netstat_container_TcpExt_IPReversePathFilter gauge
huatuo_bamai_netstat_container_TcpExt_IPReversePathFilter{container_host="coredns-855c4dd65d-8v5kg",container_hostnamespace="kube-system",container_level="burstable",container_name="coredns",container_type="normal",host="hostname",region="dev"} 0
# HELP huatuo_bamai_netstat_container_TcpExt_ListenDrops statistic TcpExtListenDrops.
# TYPE huatuo_bamai_netstat_container_TcpExt_ListenDrops gauge
huatuo_bamai_netstat_container_TcpExt_ListenDrops{container_host="coredns-855c4dd65d-8v5kg",container_hostnamespace="kube-system",container_level="burstable",container_name="coredns",container_type="normal",host="hostname",region="dev"} 0
# HELP huatuo_bamai_netstat_container_TcpExt_ListenOverflows statistic TcpExtListenOverflows.
# TYPE huatuo_bamai_netstat_container_TcpExt_ListenOverflows gauge
huatuo_bamai_netstat_container_TcpExt_ListenOverflows{container_host="coredns-855c4dd65d-8v5kg",container_hostnamespace="kube-system",container_level="burstable",container_name="coredns",container_type="normal",host="hostname",region="dev"} 0
# HELP huatuo_bamai_netstat_container_TcpExt_LockDroppedIcmps statistic TcpExtLockDroppedIcmps.
# TYPE huatuo_bamai_netstat_container_TcpExt_LockDroppedIcmps gauge
huatuo_bamai_netstat_container_TcpExt_LockDroppedIcmps{container_host="coredns-855c4dd65d-8v5kg",container_hostnamespace="kube-system",container_level="burstable",container_name="coredns",container_type="normal",host="hostname",region="dev"} 0
# HELP huatuo_bamai_netstat_container_TcpExt_OfoPruned statistic TcpExtOfoPruned.
# TYPE huatuo_bamai_netstat_container_TcpExt_OfoPruned gauge
huatuo_bamai_netstat_container_TcpExt_OfoPruned{container_host="coredns-855c4dd65d-8v5kg",container_hostnamespace="kube-system",container_level="burstable",container_name="coredns",container_type="normal",host="hostname",region="dev"} 0
# HELP huatuo_bamai_netstat_container_TcpExt_OutOfWindowIcmps statistic TcpExtOutOfWindowIcmps.
# TYPE huatuo_bamai_netstat_container_TcpExt_OutOfWindowIcmps gauge
huatuo_bamai_netstat_container_TcpExt_OutOfWindowIcmps{container_host="coredns-855c4dd65d-8v5kg",container_hostnamespace="kube-system",container_level="burstable",container_name="coredns",container_type="normal",host="hostname",region="dev"} 0
# HELP huatuo_bamai_netstat_container_TcpExt_PAWSActive statistic TcpExtPAWSActive.
# TYPE huatuo_bamai_netstat_container_TcpExt_PAWSActive gauge
huatuo_bamai_netstat_container_TcpExt_PAWSActive{container_host="coredns-855c4dd65d-8v5kg",container_hostnamespace="kube-system",container_level="burstable",container_name="coredns",container_type="normal",host="hostname",region="dev"} 0
# HELP huatuo_bamai_netstat_container_TcpExt_PAWSEstab statistic TcpExtPAWSEstab.
# TYPE huatuo_bamai_netstat_container_TcpExt_PAWSEstab gauge
huatuo_bamai_netstat_container_TcpExt_PAWSEstab{container_host="coredns-855c4dd65d-8v5kg",container_hostnamespace="kube-system",container_level="burstable",container_name="coredns",container_type="normal",host="hostname",region="dev"} 0
# HELP huatuo_bamai_netstat_container_TcpExt_PFMemallocDrop statistic TcpExtPFMemallocDrop.
# TYPE huatuo_bamai_netstat_container_TcpExt_PFMemallocDrop gauge
huatuo_bamai_netstat_container_TcpExt_PFMemallocDrop{container_host="coredns-855c4dd65d-8v5kg",container_hostnamespace="kube-system",container_level="burstable",container_name="coredns",container_type="normal",host="hostname",region="dev"} 0
# HELP huatuo_bamai_netstat_container_TcpExt_PruneCalled statistic TcpExtPruneCalled.
# TYPE huatuo_bamai_netstat_container_TcpExt_PruneCalled gauge
huatuo_bamai_netstat_container_TcpExt_PruneCalled{container_host="coredns-855c4dd65d-8v5kg",container_hostnamespace="kube-system",container_level="burstable",container_name="coredns",container_type="normal",host="hostname",region="dev"} 0
# HELP huatuo_bamai_netstat_container_TcpExt_RcvPruned statistic TcpExtRcvPruned.
# TYPE huatuo_bamai_netstat_container_TcpExt_RcvPruned gauge
huatuo_bamai_netstat_container_TcpExt_RcvPruned{container_host="coredns-855c4dd65d-8v5kg",container_hostnamespace="kube-system",container_level="burstable",container_name="coredns",container_type="normal",host="hostname",region="dev"} 0
# HELP huatuo_bamai_netstat_container_TcpExt_SyncookiesFailed statistic TcpExtSyncookiesFailed.
# TYPE huatuo_bamai_netstat_container_TcpExt_SyncookiesFailed gauge
huatuo_bamai_netstat_container_TcpExt_SyncookiesFailed{container_host="coredns-855c4dd65d-8v5kg",container_hostnamespace="kube-system",container_level="burstable",container_name="coredns",container_type="normal",host="hostname",region="dev"} 0
# HELP huatuo_bamai_netstat_container_TcpExt_SyncookiesRecv statistic TcpExtSyncookiesRecv.
# TYPE huatuo_bamai_netstat_container_TcpExt_SyncookiesRecv gauge
huatuo_bamai_netstat_container_TcpExt_SyncookiesRecv{container_host="coredns-855c4dd65d-8v5kg",container_hostnamespace="kube-system",container_level="burstable",container_name="coredns",container_type="normal",host="hostname",region="dev"} 0
# HELP huatuo_bamai_netstat_container_TcpExt_SyncookiesSent statistic TcpExtSyncookiesSent.
# TYPE huatuo_bamai_netstat_container_TcpExt_SyncookiesSent gauge
huatuo_bamai_netstat_container_TcpExt_SyncookiesSent{container_host="coredns-855c4dd65d-8v5kg",container_hostnamespace="kube-system",container_level="burstable",container_name="coredns",container_type="normal",host="hostname",region="dev"} 0
# HELP huatuo_bamai_netstat_container_TcpExt_TCPACKSkippedChallenge statistic TcpExtTCPACKSkippedChallenge.
# TYPE huatuo_bamai_netstat_container_TcpExt_TCPACKSkippedChallenge gauge
huatuo_bamai_netstat_container_TcpExt_TCPACKSkippedChallenge{container_host="coredns-855c4dd65d-8v5kg",container_hostnamespace="kube-system",container_level="burstable",container_name="coredns",container_type="normal",host="hostname",region="dev"} 0
# HELP huatuo_bamai_netstat_container_TcpExt_TCPACKSkippedFinWait2 statistic TcpExtTCPACKSkippedFinWait2.
# TYPE huatuo_bamai_netstat_container_TcpExt_TCPACKSkippedFinWait2 gauge
huatuo_bamai_netstat_container_TcpExt_TCPACKSkippedFinWait2{container_host="coredns-855c4dd65d-8v5kg",container_hostnamespace="kube-system",container_level="burstable",container_name="coredns",container_type="normal",host="hostname",region="dev"} 0
# HELP huatuo_bamai_netstat_container_TcpExt_TCPACKSkippedPAWS statistic TcpExtTCPACKSkippedPAWS.
# TYPE huatuo_bamai_netstat_container_TcpExt_TCPACKSkippedPAWS gauge
huatuo_bamai_netstat_container_TcpExt_TCPACKSkippedPAWS{container_host="coredns-855c4dd65d-8v5kg",container_hostnamespace="kube-system",container_level="burstable",container_name="coredns",container_type="normal",host="hostname",region="dev"} 0
# HELP huatuo_bamai_netstat_container_TcpExt_TCPACKSkippedSeq statistic TcpExtTCPACKSkippedSeq.
# TYPE huatuo_bamai_netstat_container_TcpExt_TCPACKSkippedSeq gauge
huatuo_bamai_netstat_container_TcpExt_TCPACKSkippedSeq{container_host="coredns-855c4dd65d-8v5kg",container_hostnamespace="kube-system",container_level="burstable",container_name="coredns",container_type="normal",host="hostname",region="dev"} 0
# HELP huatuo_bamai_netstat_container_TcpExt_TCPACKSkippedSynRecv statistic TcpExtTCPACKSkippedSynRecv.
# TYPE huatuo_bamai_netstat_container_TcpExt_TCPACKSkippedSynRecv gauge
huatuo_bamai_netstat_container_TcpExt_TCPACKSkippedSynRecv{container_host="coredns-855c4dd65d-8v5kg",container_hostnamespace="kube-system",container_level="burstable",container_name="coredns",container_type="normal",host="hostname",region="dev"} 0
# HELP huatuo_bamai_netstat_container_TcpExt_TCPACKSkippedTimeWait statistic TcpExtTCPACKSkippedTimeWait.
# TYPE huatuo_bamai_netstat_container_TcpExt_TCPACKSkippedTimeWait gauge
huatuo_bamai_netstat_container_TcpExt_TCPACKSkippedTimeWait{container_host="coredns-855c4dd65d-8v5kg",container_hostnamespace="kube-system",container_level="burstable",container_name="coredns",container_type="normal",host="hostname",region="dev"} 0
# HELP huatuo_bamai_netstat_container_TcpExt_TCPAOBad statistic TcpExtTCPAOBad.
# TYPE huatuo_bamai_netstat_container_TcpExt_TCPAOBad gauge
huatuo_bamai_netstat_container_TcpExt_TCPAOBad{container_host="coredns-855c4dd65d-8v5kg",container_hostnamespace="kube-system",container_level="burstable",container_name="coredns",container_type="normal",host="hostname",region="dev"} 0
# HELP huatuo_bamai_netstat_container_TcpExt_TCPAODroppedIcmps statistic TcpExtTCPAODroppedIcmps.
# TYPE huatuo_bamai_netstat_container_TcpExt_TCPAODroppedIcmps gauge
huatuo_bamai_netstat_container_TcpExt_TCPAODroppedIcmps{container_host="coredns-855c4dd65d-8v5kg",container_hostnamespace="kube-system",container_level="burstable",container_name="coredns",container_type="normal",host="hostname",region="dev"} 0
# HELP huatuo_bamai_netstat_container_TcpExt_TCPAOGood statistic TcpExtTCPAOGood.
# TYPE huatuo_bamai_netstat_container_TcpExt_TCPAOGood gauge
huatuo_bamai_netstat_container_TcpExt_TCPAOGood{container_host="coredns-855c4dd65d-8v5kg",container_hostnamespace="kube-system",container_level="burstable",container_name="coredns",container_type="normal",host="hostname",region="dev"} 0
# HELP huatuo_bamai_netstat_container_TcpExt_TCPAOKeyNotFound statistic TcpExtTCPAOKeyNotFound.
# TYPE huatuo_bamai_netstat_container_TcpExt_TCPAOKeyNotFound gauge
huatuo_bamai_netstat_container_TcpExt_TCPAOKeyNotFound{container_host="coredns-855c4dd65d-8v5kg",container_hostnamespace="kube-system",container_level="burstable",container_name="coredns",container_type="normal",host="hostname",region="dev"} 0
# HELP huatuo_bamai_netstat_container_TcpExt_TCPAORequired statistic TcpExtTCPAORequired.
# TYPE huatuo_bamai_netstat_container_TcpExt_TCPAORequired gauge
huatuo_bamai_netstat_container_TcpExt_TCPAORequired{container_host="coredns-855c4dd65d-8v5kg",container_hostnamespace="kube-system",container_level="burstable",container_name="coredns",container_type="normal",host="hostname",region="dev"} 0
# HELP huatuo_bamai_netstat_container_TcpExt_TCPAbortFailed statistic TcpExtTCPAbortFailed.
# TYPE huatuo_bamai_netstat_container_TcpExt_TCPAbortFailed gauge
huatuo_bamai_netstat_container_TcpExt_TCPAbortFailed{container_host="coredns-855c4dd65d-8v5kg",container_hostnamespace="kube-system",container_level="burstable",container_name="coredns",container_type="normal",host="hostname",region="dev"} 0
# HELP huatuo_bamai_netstat_container_TcpExt_TCPAbortOnClose statistic TcpExtTCPAbortOnClose.
# TYPE huatuo_bamai_netstat_container_TcpExt_TCPAbortOnClose gauge
huatuo_bamai_netstat_container_TcpExt_TCPAbortOnClose{container_host="coredns-855c4dd65d-8v5kg",container_hostnamespace="kube-system",container_level="burstable",container_name="coredns",container_type="normal",host="hostname",region="dev"} 1
# HELP huatuo_bamai_netstat_container_TcpExt_TCPAbortOnData statistic TcpExtTCPAbortOnData.
# TYPE huatuo_bamai_netstat_container_TcpExt_TCPAbortOnData gauge
huatuo_bamai_netstat_container_TcpExt_TCPAbortOnData{container_host="coredns-855c4dd65d-8v5kg",container_hostnamespace="kube-system",container_level="burstable",container_name="coredns",container_type="normal",host="hostname",region="dev"} 0
# HELP huatuo_bamai_netstat_container_TcpExt_TCPAbortOnLinger statistic TcpExtTCPAbortOnLinger.
# TYPE huatuo_bamai_netstat_container_TcpExt_TCPAbortOnLinger gauge
huatuo_bamai_netstat_container_TcpExt_TCPAbortOnLinger{container_host="coredns-855c4dd65d-8v5kg",container_hostnamespace="kube-system",container_level="burstable",container_name="coredns",container_type="normal",host="hostname",region="dev"} 0
# HELP huatuo_bamai_netstat_container_TcpExt_TCPAbortOnMemory statistic TcpExtTCPAbortOnMemory.
# TYPE huatuo_bamai_netstat_container_TcpExt_TCPAbortOnMemory gauge
huatuo_bamai_netstat_container_TcpExt_TCPAbortOnMemory{container_host="coredns-855c4dd65d-8v5kg",container_hostnamespace="kube-system",container_level="burstable",container_name="coredns",container_type="normal",host="hostname",region="dev"} 0
# HELP huatuo_bamai_netstat_container_TcpExt_TCPAbortOnTimeout statistic TcpExtTCPAbortOnTimeout.
# TYPE huatuo_bamai_netstat_container_TcpExt_TCPAbortOnTimeout gauge
huatuo_bamai_netstat_container_TcpExt_TCPAbortOnTimeout{container_host="coredns-855c4dd65d-8v5kg",container_hostnamespace="kube-system",container_level="burstable",container_name="coredns",container_type="normal",host="hostname",region="dev"} 0
# HELP huatuo_bamai_netstat_container_TcpExt_TCPAckCompressed statistic TcpExtTCPAckCompressed.
# TYPE huatuo_bamai_netstat_container_TcpExt_TCPAckCompressed gauge
huatuo_bamai_netstat_container_TcpExt_TCPAckCompressed{container_host="coredns-855c4dd65d-8v5kg",container_hostnamespace="kube-system",container_level="burstable",container_name="coredns",container_type="normal",host="hostname",region="dev"} 0
# HELP huatuo_bamai_netstat_container_TcpExt_TCPAutoCorking statistic TcpExtTCPAutoCorking.
# TYPE huatuo_bamai_netstat_container_TcpExt_TCPAutoCorking gauge
huatuo_bamai_netstat_container_TcpExt_TCPAutoCorking{container_host="coredns-855c4dd65d-8v5kg",container_hostnamespace="kube-system",container_level="burstable",container_name="coredns",container_type="normal",host="hostname",region="dev"} 0
# HELP huatuo_bamai_netstat_container_TcpExt_TCPBacklogCoalesce statistic TcpExtTCPBacklogCoalesce.
# TYPE huatuo_bamai_netstat_container_TcpExt_TCPBacklogCoalesce gauge
huatuo_bamai_netstat_container_TcpExt_TCPBacklogCoalesce{container_host="coredns-855c4dd65d-8v5kg",container_hostnamespace="kube-system",container_level="burstable",container_name="coredns",container_type="normal",host="hostname",region="dev"} 3
# HELP huatuo_bamai_netstat_container_TcpExt_TCPBacklogDrop statistic TcpExtTCPBacklogDrop.
# TYPE huatuo_bamai_netstat_container_TcpExt_TCPBacklogDrop gauge
huatuo_bamai_netstat_container_TcpExt_TCPBacklogDrop{container_host="coredns-855c4dd65d-8v5kg",container_hostnamespace="kube-system",container_level="burstable",container_name="coredns",container_type="normal",host="hostname",region="dev"} 0
# HELP huatuo_bamai_netstat_container_TcpExt_TCPChallengeACK statistic TcpExtTCPChallengeACK.
# TYPE huatuo_bamai_netstat_container_TcpExt_TCPChallengeACK gauge
huatuo_bamai_netstat_container_TcpExt_TCPChallengeACK{container_host="coredns-855c4dd65d-8v5kg",container_hostnamespace="kube-system",container_level="burstable",container_name="coredns",container_type="normal",host="hostname",region="dev"} 0
# HELP huatuo_bamai_netstat_container_TcpExt_TCPDSACKIgnoredDubious statistic TcpExtTCPDSACKIgnoredDubious.
# TYPE huatuo_bamai_netstat_container_TcpExt_TCPDSACKIgnoredDubious gauge
huatuo_bamai_netstat_container_TcpExt_TCPDSACKIgnoredDubious{container_host="coredns-855c4dd65d-8v5kg",container_hostnamespace="kube-system",container_level="burstable",container_name="coredns",container_type="normal",host="hostname",region="dev"} 0
# HELP huatuo_bamai_netstat_container_TcpExt_TCPDSACKIgnoredNoUndo statistic TcpExtTCPDSACKIgnoredNoUndo.
# TYPE huatuo_bamai_netstat_container_TcpExt_TCPDSACKIgnoredNoUndo gauge
huatuo_bamai_netstat_container_TcpExt_TCPDSACKIgnoredNoUndo{container_host="coredns-855c4dd65d-8v5kg",container_hostnamespace="kube-system",container_level="burstable",container_name="coredns",container_type="normal",host="hostname",region="dev"} 1
# HELP huatuo_bamai_netstat_container_TcpExt_TCPDSACKIgnoredOld statistic TcpExtTCPDSACKIgnoredOld.
# TYPE huatuo_bamai_netstat_container_TcpExt_TCPDSACKIgnoredOld gauge
huatuo_bamai_netstat_container_TcpExt_TCPDSACKIgnoredOld{container_host="coredns-855c4dd65d-8v5kg",container_hostnamespace="kube-system",container_level="burstable",container_name="coredns",container_type="normal",host="hostname",region="dev"} 0
# HELP huatuo_bamai_netstat_container_TcpExt_TCPDSACKOfoRecv statistic TcpExtTCPDSACKOfoRecv.
# TYPE huatuo_bamai_netstat_container_TcpExt_TCPDSACKOfoRecv gauge
huatuo_bamai_netstat_container_TcpExt_TCPDSACKOfoRecv{container_host="coredns-855c4dd65d-8v5kg",container_hostnamespace="kube-system",container_level="burstable",container_name="coredns",container_type="normal",host="hostname",region="dev"} 0
# HELP huatuo_bamai_netstat_container_TcpExt_TCPDSACKOfoSent statistic TcpExtTCPDSACKOfoSent.
# TYPE huatuo_bamai_netstat_container_TcpExt_TCPDSACKOfoSent gauge
huatuo_bamai_netstat_container_TcpExt_TCPDSACKOfoSent{container_host="coredns-855c4dd65d-8v5kg",container_hostnamespace="kube-system",container_level="burstable",container_name="coredns",container_type="normal",host="hostname",region="dev"} 0
# HELP huatuo_bamai_netstat_container_TcpExt_TCPDSACKOldSent statistic TcpExtTCPDSACKOldSent.
# TYPE huatuo_bamai_netstat_container_TcpExt_TCPDSACKOldSent gauge
huatuo_bamai_netstat_container_TcpExt_TCPDSACKOldSent{container_host="coredns-855c4dd65d-8v5kg",container_hostnamespace="kube-system",container_level="burstable",container_name="coredns",container_type="normal",host="hostname",region="dev"} 0
# HELP huatuo_bamai_netstat_container_TcpExt_TCPDSACKRecv statistic TcpExtTCPDSACKRecv.
# TYPE huatuo_bamai_netstat_container_TcpExt_TCPDSACKRecv gauge
huatuo_bamai_netstat_container_TcpExt_TCPDSACKRecv{container_host="coredns-855c4dd65d-8v5kg",container_hostnamespace="kube-system",container_level="burstable",container_name="coredns",container_type="normal",host="hostname",region="dev"} 1
# HELP huatuo_bamai_netstat_container_TcpExt_TCPDSACKRecvSegs statistic TcpExtTCPDSACKRecvSegs.
# TYPE huatuo_bamai_netstat_container_TcpExt_TCPDSACKRecvSegs gauge
huatuo_bamai_netstat_container_TcpExt_TCPDSACKRecvSegs{container_host="coredns-855c4dd65d-8v5kg",container_hostnamespace="kube-system",container_level="burstable",container_name="coredns",container_type="normal",host="hostname",region="dev"} 1
# HELP huatuo_bamai_netstat_container_TcpExt_TCPDSACKUndo statistic TcpExtTCPDSACKUndo.
# TYPE huatuo_bamai_netstat_container_TcpExt_TCPDSACKUndo gauge
huatuo_bamai_netstat_container_TcpExt_TCPDSACKUndo{container_host="coredns-855c4dd65d-8v5kg",container_hostnamespace="kube-system",container_level="burstable",container_name="coredns",container_type="normal",host="hostname",region="dev"} 0
# HELP huatuo_bamai_netstat_container_TcpExt_TCPDeferAcceptDrop statistic TcpExtTCPDeferAcceptDrop.
# TYPE huatuo_bamai_netstat_container_TcpExt_TCPDeferAcceptDrop gauge
huatuo_bamai_netstat_container_TcpExt_TCPDeferAcceptDrop{container_host="coredns-855c4dd65d-8v5kg",container_hostnamespace="kube-system",container_level="burstable",container_name="coredns",container_type="normal",host="hostname",region="dev"} 0
# HELP huatuo_bamai_netstat_container_TcpExt_TCPDelivered statistic TcpExtTCPDelivered.
# TYPE huatuo_bamai_netstat_container_TcpExt_TCPDelivered gauge
huatuo_bamai_netstat_container_TcpExt_TCPDelivered{container_host="coredns-855c4dd65d-8v5kg",container_hostnamespace="kube-system",container_level="burstable",container_name="coredns",container_type="normal",host="hostname",region="dev"} 3.28098e+06
# HELP huatuo_bamai_netstat_container_TcpExt_TCPDeliveredCE statistic TcpExtTCPDeliveredCE.
# TYPE huatuo_bamai_netstat_container_TcpExt_TCPDeliveredCE gauge
huatuo_bamai_netstat_container_TcpExt_TCPDeliveredCE{container_host="coredns-855c4dd65d-8v5kg",container_hostnamespace="kube-system",container_level="burstable",container_name="coredns",container_type="normal",host="hostname",region="dev"} 0
# HELP huatuo_bamai_netstat_container_TcpExt_TCPFastOpenActive statistic TcpExtTCPFastOpenActive.
# TYPE huatuo_bamai_netstat_container_TcpExt_TCPFastOpenActive gauge
huatuo_bamai_netstat_container_TcpExt_TCPFastOpenActive{container_host="coredns-855c4dd65d-8v5kg",container_hostnamespace="kube-system",container_level="burstable",container_name="coredns",container_type="normal",host="hostname",region="dev"} 0
# HELP huatuo_bamai_netstat_container_TcpExt_TCPFastOpenActiveFail statistic TcpExtTCPFastOpenActiveFail.
# TYPE huatuo_bamai_netstat_container_TcpExt_TCPFastOpenActiveFail gauge
huatuo_bamai_netstat_container_TcpExt_TCPFastOpenActiveFail{container_host="coredns-855c4dd65d-8v5kg",container_hostnamespace="kube-system",container_level="burstable",container_name="coredns",container_type="normal",host="hostname",region="dev"} 0
# HELP huatuo_bamai_netstat_container_TcpExt_TCPFastOpenBlackhole statistic TcpExtTCPFastOpenBlackhole.
# TYPE huatuo_bamai_netstat_container_TcpExt_TCPFastOpenBlackhole gauge
huatuo_bamai_netstat_container_TcpExt_TCPFastOpenBlackhole{container_host="coredns-855c4dd65d-8v5kg",container_hostnamespace="kube-system",container_level="burstable",container_name="coredns",container_type="normal",host="hostname",region="dev"} 0
# HELP huatuo_bamai_netstat_container_TcpExt_TCPFastOpenCookieReqd statistic TcpExtTCPFastOpenCookieReqd.
# TYPE huatuo_bamai_netstat_container_TcpExt_TCPFastOpenCookieReqd gauge
huatuo_bamai_netstat_container_TcpExt_TCPFastOpenCookieReqd{container_host="coredns-855c4dd65d-8v5kg",container_hostnamespace="kube-system",container_level="burstable",container_name="coredns",container_type="normal",host="hostname",region="dev"} 0
# HELP huatuo_bamai_netstat_container_TcpExt_TCPFastOpenListenOverflow statistic TcpExtTCPFastOpenListenOverflow.
# TYPE huatuo_bamai_netstat_container_TcpExt_TCPFastOpenListenOverflow gauge
huatuo_bamai_netstat_container_TcpExt_TCPFastOpenListenOverflow{container_host="coredns-855c4dd65d-8v5kg",container_hostnamespace="kube-system",container_level="burstable",container_name="coredns",container_type="normal",host="hostname",region="dev"} 0
# HELP huatuo_bamai_netstat_container_TcpExt_TCPFastOpenPassive statistic TcpExtTCPFastOpenPassive.
# TYPE huatuo_bamai_netstat_container_TcpExt_TCPFastOpenPassive gauge
huatuo_bamai_netstat_container_TcpExt_TCPFastOpenPassive{container_host="coredns-855c4dd65d-8v5kg",container_hostnamespace="kube-system",container_level="burstable",container_name="coredns",container_type="normal",host="hostname",region="dev"} 0
# HELP huatuo_bamai_netstat_container_TcpExt_TCPFastOpenPassiveAltKey statistic TcpExtTCPFastOpenPassiveAltKey.
# TYPE huatuo_bamai_netstat_container_TcpExt_TCPFastOpenPassiveAltKey gauge
huatuo_bamai_netstat_container_TcpExt_TCPFastOpenPassiveAltKey{container_host="coredns-855c4dd65d-8v5kg",container_hostnamespace="kube-system",container_level="burstable",container_name="coredns",container_type="normal",host="hostname",region="dev"} 0
# HELP huatuo_bamai_netstat_container_TcpExt_TCPFastOpenPassiveFail statistic TcpExtTCPFastOpenPassiveFail.
# TYPE huatuo_bamai_netstat_container_TcpExt_TCPFastOpenPassiveFail gauge
huatuo_bamai_netstat_container_TcpExt_TCPFastOpenPassiveFail{container_host="coredns-855c4dd65d-8v5kg",container_hostnamespace="kube-system",container_level="burstable",container_name="coredns",container_type="normal",host="hostname",region="dev"} 0
# HELP huatuo_bamai_netstat_container_TcpExt_TCPFastRetrans statistic TcpExtTCPFastRetrans.
# TYPE huatuo_bamai_netstat_container_TcpExt_TCPFastRetrans gauge
huatuo_bamai_netstat_container_TcpExt_TCPFastRetrans{container_host="coredns-855c4dd65d-8v5kg",container_hostnamespace="kube-system",container_level="burstable",container_name="coredns",container_type="normal",host="hostname",region="dev"} 0
# HELP huatuo_bamai_netstat_container_TcpExt_TCPFromZeroWindowAdv statistic TcpExtTCPFromZeroWindowAdv.
# TYPE huatuo_bamai_netstat_container_TcpExt_TCPFromZeroWindowAdv gauge
huatuo_bamai_netstat_container_TcpExt_TCPFromZeroWindowAdv{container_host="coredns-855c4dd65d-8v5kg",container_hostnamespace="kube-system",container_level="burstable",container_name="coredns",container_type="normal",host="hostname",region="dev"} 0
# HELP huatuo_bamai_netstat_container_TcpExt_TCPFullUndo statistic TcpExtTCPFullUndo.
# TYPE huatuo_bamai_netstat_container_TcpExt_TCPFullUndo gauge
huatuo_bamai_netstat_container_TcpExt_TCPFullUndo{container_host="coredns-855c4dd65d-8v5kg",container_hostnamespace="kube-system",container_level="burstable",container_name="coredns",container_type="normal",host="hostname",region="dev"} 0
# HELP huatuo_bamai_netstat_container_TcpExt_TCPHPAcks statistic TcpExtTCPHPAcks.
# TYPE huatuo_bamai_netstat_container_TcpExt_TCPHPAcks gauge
huatuo_bamai_netstat_container_TcpExt_TCPHPAcks{container_host="coredns-855c4dd65d-8v5kg",container_hostnamespace="kube-system",container_level="burstable",container_name="coredns",container_type="normal",host="hostname",region="dev"} 616667
# HELP huatuo_bamai_netstat_container_TcpExt_TCPHPHits statistic TcpExtTCPHPHits.
# TYPE huatuo_bamai_netstat_container_TcpExt_TCPHPHits gauge
huatuo_bamai_netstat_container_TcpExt_TCPHPHits{container_host="coredns-855c4dd65d-8v5kg",container_hostnamespace="kube-system",container_level="burstable",container_name="coredns",container_type="normal",host="hostname",region="dev"} 9913
# HELP huatuo_bamai_netstat_container_TcpExt_TCPHystartDelayCwnd statistic TcpExtTCPHystartDelayCwnd.
# TYPE huatuo_bamai_netstat_container_TcpExt_TCPHystartDelayCwnd gauge
huatuo_bamai_netstat_container_TcpExt_TCPHystartDelayCwnd{container_host="coredns-855c4dd65d-8v5kg",container_hostnamespace="kube-system",container_level="burstable",container_name="coredns",container_type="normal",host="hostname",region="dev"} 0
# HELP huatuo_bamai_netstat_container_TcpExt_TCPHystartDelayDetect statistic TcpExtTCPHystartDelayDetect.
# TYPE huatuo_bamai_netstat_container_TcpExt_TCPHystartDelayDetect gauge
huatuo_bamai_netstat_container_TcpExt_TCPHystartDelayDetect{container_host="coredns-855c4dd65d-8v5kg",container_hostnamespace="kube-system",container_level="burstable",container_name="coredns",container_type="normal",host="hostname",region="dev"} 0
# HELP huatuo_bamai_netstat_container_TcpExt_TCPHystartTrainCwnd statistic TcpExtTCPHystartTrainCwnd.
# TYPE huatuo_bamai_netstat_container_TcpExt_TCPHystartTrainCwnd gauge
huatuo_bamai_netstat_container_TcpExt_TCPHystartTrainCwnd{container_host="coredns-855c4dd65d-8v5kg",container_hostnamespace="kube-system",container_level="burstable",container_name="coredns",container_type="normal",host="hostname",region="dev"} 0
# HELP huatuo_bamai_netstat_container_TcpExt_TCPHystartTrainDetect statistic TcpExtTCPHystartTrainDetect.
# TYPE huatuo_bamai_netstat_container_TcpExt_TCPHystartTrainDetect gauge
huatuo_bamai_netstat_container_TcpExt_TCPHystartTrainDetect{container_host="coredns-855c4dd65d-8v5kg",container_hostnamespace="kube-system",container_level="burstable",container_name="coredns",container_type="normal",host="hostname",region="dev"} 0
# HELP huatuo_bamai_netstat_container_TcpExt_TCPKeepAlive statistic TcpExtTCPKeepAlive.
# TYPE huatuo_bamai_netstat_container_TcpExt_TCPKeepAlive gauge
huatuo_bamai_netstat_container_TcpExt_TCPKeepAlive{container_host="coredns-855c4dd65d-8v5kg",container_hostnamespace="kube-system",container_level="burstable",container_name="coredns",container_type="normal",host="hostname",region="dev"} 20
# HELP huatuo_bamai_netstat_container_TcpExt_TCPLossFailures statistic TcpExtTCPLossFailures.
# TYPE huatuo_bamai_netstat_container_TcpExt_TCPLossFailures gauge
huatuo_bamai_netstat_container_TcpExt_TCPLossFailures{container_host="coredns-855c4dd65d-8v5kg",container_hostnamespace="kube-system",container_level="burstable",container_name="coredns",container_type="normal",host="hostname",region="dev"} 0
# HELP huatuo_bamai_netstat_container_TcpExt_TCPLossProbeRecovery statistic TcpExtTCPLossProbeRecovery.
# TYPE huatuo_bamai_netstat_container_TcpExt_TCPLossProbeRecovery gauge
huatuo_bamai_netstat_container_TcpExt_TCPLossProbeRecovery{container_host="coredns-855c4dd65d-8v5kg",container_hostnamespace="kube-system",container_level="burstable",container_name="coredns",container_type="normal",host="hostname",region="dev"} 0
# HELP huatuo_bamai_netstat_container_TcpExt_TCPLossProbes statistic TcpExtTCPLossProbes.
# TYPE huatuo_bamai_netstat_container_TcpExt_TCPLossProbes gauge
huatuo_bamai_netstat_container_TcpExt_TCPLossProbes{container_host="coredns-855c4dd65d-8v5kg",container_hostnamespace="kube-system",container_level="burstable",container_name="coredns",container_type="normal",host="hostname",region="dev"} 1
# HELP huatuo_bamai_netstat_container_TcpExt_TCPLossUndo statistic TcpExtTCPLossUndo.
# TYPE huatuo_bamai_netstat_container_TcpExt_TCPLossUndo gauge
huatuo_bamai_netstat_container_TcpExt_TCPLossUndo{container_host="coredns-855c4dd65d-8v5kg",container_hostnamespace="kube-system",container_level="burstable",container_name="coredns",container_type="normal",host="hostname",region="dev"} 0
# HELP huatuo_bamai_netstat_container_TcpExt_TCPLostRetransmit statistic TcpExtTCPLostRetransmit.
# TYPE huatuo_bamai_netstat_container_TcpExt_TCPLostRetransmit gauge
huatuo_bamai_netstat_container_TcpExt_TCPLostRetransmit{container_host="coredns-855c4dd65d-8v5kg",container_hostnamespace="kube-system",container_level="burstable",container_name="coredns",container_type="normal",host="hostname",region="dev"} 0
# HELP huatuo_bamai_netstat_container_TcpExt_TCPMD5Failure statistic TcpExtTCPMD5Failure.
# TYPE huatuo_bamai_netstat_container_TcpExt_TCPMD5Failure gauge
huatuo_bamai_netstat_container_TcpExt_TCPMD5Failure{container_host="coredns-855c4dd65d-8v5kg",container_hostnamespace="kube-system",container_level="burstable",container_name="coredns",container_type="normal",host="hostname",region="dev"} 0
# HELP huatuo_bamai_netstat_container_TcpExt_TCPMD5NotFound statistic TcpExtTCPMD5NotFound.
# TYPE huatuo_bamai_netstat_container_TcpExt_TCPMD5NotFound gauge
huatuo_bamai_netstat_container_TcpExt_TCPMD5NotFound{container_host="coredns-855c4dd65d-8v5kg",container_hostnamespace="kube-system",container_level="burstable",container_name="coredns",container_type="normal",host="hostname",region="dev"} 0
# HELP huatuo_bamai_netstat_container_TcpExt_TCPMD5Unexpected statistic TcpExtTCPMD5Unexpected.
# TYPE huatuo_bamai_netstat_container_TcpExt_TCPMD5Unexpected gauge
huatuo_bamai_netstat_container_TcpExt_TCPMD5Unexpected{container_host="coredns-855c4dd65d-8v5kg",container_hostnamespace="kube-system",container_level="burstable",container_name="coredns",container_type="normal",host="hostname",region="dev"} 0
# HELP huatuo_bamai_netstat_container_TcpExt_TCPMTUPFail statistic TcpExtTCPMTUPFail.
# TYPE huatuo_bamai_netstat_container_TcpExt_TCPMTUPFail gauge
huatuo_bamai_netstat_container_TcpExt_TCPMTUPFail{container_host="coredns-855c4dd65d-8v5kg",container_hostnamespace="kube-system",container_level="burstable",container_name="coredns",container_type="normal",host="hostname",region="dev"} 0
# HELP huatuo_bamai_netstat_container_TcpExt_TCPMTUPSuccess statistic TcpExtTCPMTUPSuccess.
# TYPE huatuo_bamai_netstat_container_TcpExt_TCPMTUPSuccess gauge
huatuo_bamai_netstat_container_TcpExt_TCPMTUPSuccess{container_host="coredns-855c4dd65d-8v5kg",container_hostnamespace="kube-system",container_level="burstable",container_name="coredns",container_type="normal",host="hostname",region="dev"} 0
# HELP huatuo_bamai_netstat_container_TcpExt_TCPMemoryPressures statistic TcpExtTCPMemoryPressures.
# TYPE huatuo_bamai_netstat_container_TcpExt_TCPMemoryPressures gauge
huatuo_bamai_netstat_container_TcpExt_TCPMemoryPressures{container_host="coredns-855c4dd65d-8v5kg",container_hostnamespace="kube-system",container_level="burstable",container_name="coredns",container_type="normal",host="hostname",region="dev"} 0
# HELP huatuo_bamai_netstat_container_TcpExt_TCPMemoryPressuresChrono statistic TcpExtTCPMemoryPressuresChrono.
# TYPE huatuo_bamai_netstat_container_TcpExt_TCPMemoryPressuresChrono gauge
huatuo_bamai_netstat_container_TcpExt_TCPMemoryPressuresChrono{container_host="coredns-855c4dd65d-8v5kg",container_hostnamespace="kube-system",container_level="burstable",container_name="coredns",container_type="normal",host="hostname",region="dev"} 0
# HELP huatuo_bamai_netstat_container_TcpExt_TCPMigrateReqFailure statistic TcpExtTCPMigrateReqFailure.
# TYPE huatuo_bamai_netstat_container_TcpExt_TCPMigrateReqFailure gauge
huatuo_bamai_netstat_container_TcpExt_TCPMigrateReqFailure{container_host="coredns-855c4dd65d-8v5kg",container_hostnamespace="kube-system",container_level="burstable",container_name="coredns",container_type="normal",host="hostname",region="dev"} 0
# HELP huatuo_bamai_netstat_container_TcpExt_TCPMigrateReqSuccess statistic TcpExtTCPMigrateReqSuccess.
# TYPE huatuo_bamai_netstat_container_TcpExt_TCPMigrateReqSuccess gauge
huatuo_bamai_netstat_container_TcpExt_TCPMigrateReqSuccess{container_host="coredns-855c4dd65d-8v5kg",container_hostnamespace="kube-system",container_level="burstable",container_name="coredns",container_type="normal",host="hostname",region="dev"} 0
# HELP huatuo_bamai_netstat_container_TcpExt_TCPMinTTLDrop statistic TcpExtTCPMinTTLDrop.
# TYPE huatuo_bamai_netstat_container_TcpExt_TCPMinTTLDrop gauge
huatuo_bamai_netstat_container_TcpExt_TCPMinTTLDrop{container_host="coredns-855c4dd65d-8v5kg",container_hostnamespace="kube-system",container_level="burstable",container_name="coredns",container_type="normal",host="hostname",region="dev"} 0
# HELP huatuo_bamai_netstat_container_TcpExt_TCPOFODrop statistic TcpExtTCPOFODrop.
# TYPE huatuo_bamai_netstat_container_TcpExt_TCPOFODrop gauge
huatuo_bamai_netstat_container_TcpExt_TCPOFODrop{container_host="coredns-855c4dd65d-8v5kg",container_hostnamespace="kube-system",container_level="burstable",container_name="coredns",container_type="normal",host="hostname",region="dev"} 0
# HELP huatuo_bamai_netstat_container_TcpExt_TCPOFOMerge statistic TcpExtTCPOFOMerge.
# TYPE huatuo_bamai_netstat_container_TcpExt_TCPOFOMerge gauge
huatuo_bamai_netstat_container_TcpExt_TCPOFOMerge{container_host="coredns-855c4dd65d-8v5kg",container_hostnamespace="kube-system",container_level="burstable",container_name="coredns",container_type="normal",host="hostname",region="dev"} 0
# HELP huatuo_bamai_netstat_container_TcpExt_TCPOFOQueue statistic TcpExtTCPOFOQueue.
# TYPE huatuo_bamai_netstat_container_TcpExt_TCPOFOQueue gauge
huatuo_bamai_netstat_container_TcpExt_TCPOFOQueue{container_host="coredns-855c4dd65d-8v5kg",container_hostnamespace="kube-system",container_level="burstable",container_name="coredns",container_type="normal",host="hostname",region="dev"} 0
# HELP huatuo_bamai_netstat_container_TcpExt_TCPOrigDataSent statistic TcpExtTCPOrigDataSent.
# TYPE huatuo_bamai_netstat_container_TcpExt_TCPOrigDataSent gauge
huatuo_bamai_netstat_container_TcpExt_TCPOrigDataSent{container_host="coredns-855c4dd65d-8v5kg",container_hostnamespace="kube-system",container_level="burstable",container_name="coredns",container_type="normal",host="hostname",region="dev"} 2.675557e+06
# HELP huatuo_bamai_netstat_container_TcpExt_TCPPLBRehash statistic TcpExtTCPPLBRehash.
# TYPE huatuo_bamai_netstat_container_TcpExt_TCPPLBRehash gauge
huatuo_bamai_netstat_container_TcpExt_TCPPLBRehash{container_host="coredns-855c4dd65d-8v5kg",container_hostnamespace="kube-system",container_level="burstable",container_name="coredns",container_type="normal",host="hostname",region="dev"} 0
# HELP huatuo_bamai_netstat_container_TcpExt_TCPPartialUndo statistic TcpExtTCPPartialUndo.
# TYPE huatuo_bamai_netstat_container_TcpExt_TCPPartialUndo gauge
huatuo_bamai_netstat_container_TcpExt_TCPPartialUndo{container_host="coredns-855c4dd65d-8v5kg",container_hostnamespace="kube-system",container_level="burstable",container_name="coredns",container_type="normal",host="hostname",region="dev"} 0
# HELP huatuo_bamai_netstat_container_TcpExt_TCPPureAcks statistic TcpExtTCPPureAcks.
# TYPE huatuo_bamai_netstat_container_TcpExt_TCPPureAcks gauge
huatuo_bamai_netstat_container_TcpExt_TCPPureAcks{container_host="coredns-855c4dd65d-8v5kg",container_hostnamespace="kube-system",container_level="burstable",container_name="coredns",container_type="normal",host="hostname",region="dev"} 2.095262e+06
# HELP huatuo_bamai_netstat_container_TcpExt_TCPRcvCoalesce statistic TcpExtTCPRcvCoalesce.
# TYPE huatuo_bamai_netstat_container_TcpExt_TCPRcvCoalesce gauge
huatuo_bamai_netstat_container_TcpExt_TCPRcvCoalesce{container_host="coredns-855c4dd65d-8v5kg",container_hostnamespace="kube-system",container_level="burstable",container_name="coredns",container_type="normal",host="hostname",region="dev"} 3
# HELP huatuo_bamai_netstat_container_TcpExt_TCPRcvCollapsed statistic TcpExtTCPRcvCollapsed.
# TYPE huatuo_bamai_netstat_container_TcpExt_TCPRcvCollapsed gauge
huatuo_bamai_netstat_container_TcpExt_TCPRcvCollapsed{container_host="coredns-855c4dd65d-8v5kg",container_hostnamespace="kube-system",container_level="burstable",container_name="coredns",container_type="normal",host="hostname",region="dev"} 0
# HELP huatuo_bamai_netstat_container_TcpExt_TCPRcvQDrop statistic TcpExtTCPRcvQDrop.
# TYPE huatuo_bamai_netstat_container_TcpExt_TCPRcvQDrop gauge
huatuo_bamai_netstat_container_TcpExt_TCPRcvQDrop{container_host="coredns-855c4dd65d-8v5kg",container_hostnamespace="kube-system",container_level="burstable",container_name="coredns",container_type="normal",host="hostname",region="dev"} 0
# HELP huatuo_bamai_netstat_container_TcpExt_TCPRenoFailures statistic TcpExtTCPRenoFailures.
# TYPE huatuo_bamai_netstat_container_TcpExt_TCPRenoFailures gauge
huatuo_bamai_netstat_container_TcpExt_TCPRenoFailures{container_host="coredns-855c4dd65d-8v5kg",container_hostnamespace="kube-system",container_level="burstable",container_name="coredns",container_type="normal",host="hostname",region="dev"} 0
# HELP huatuo_bamai_netstat_container_TcpExt_TCPRenoRecovery statistic TcpExtTCPRenoRecovery.
# TYPE huatuo_bamai_netstat_container_TcpExt_TCPRenoRecovery gauge
huatuo_bamai_netstat_container_TcpExt_TCPRenoRecovery{container_host="coredns-855c4dd65d-8v5kg",container_hostnamespace="kube-system",container_level="burstable",container_name="coredns",container_type="normal",host="hostname",region="dev"} 0
# HELP huatuo_bamai_netstat_container_TcpExt_TCPRenoRecoveryFail statistic TcpExtTCPRenoRecoveryFail.
# TYPE huatuo_bamai_netstat_container_TcpExt_TCPRenoRecoveryFail gauge
huatuo_bamai_netstat_container_TcpExt_TCPRenoRecoveryFail{container_host="coredns-855c4dd65d-8v5kg",container_hostnamespace="kube-system",container_level="burstable",container_name="coredns",container_type="normal",host="hostname",region="dev"} 0
# HELP huatuo_bamai_netstat_container_TcpExt_TCPRenoReorder statistic TcpExtTCPRenoReorder.
# TYPE huatuo_bamai_netstat_container_TcpExt_TCPRenoReorder gauge
huatuo_bamai_netstat_container_TcpExt_TCPRenoReorder{container_host="coredns-855c4dd65d-8v5kg",container_hostnamespace="kube-system",container_level="burstable",container_name="coredns",container_type="normal",host="hostname",region="dev"} 0
# HELP huatuo_bamai_netstat_container_TcpExt_TCPReqQFullDoCookies statistic TcpExtTCPReqQFullDoCookies.
# TYPE huatuo_bamai_netstat_container_TcpExt_TCPReqQFullDoCookies gauge
huatuo_bamai_netstat_container_TcpExt_TCPReqQFullDoCookies{container_host="coredns-855c4dd65d-8v5kg",container_hostnamespace="kube-system",container_level="burstable",container_name="coredns",container_type="normal",host="hostname",region="dev"} 0
# HELP huatuo_bamai_netstat_container_TcpExt_TCPReqQFullDrop statistic TcpExtTCPReqQFullDrop.
# TYPE huatuo_bamai_netstat_container_TcpExt_TCPReqQFullDrop gauge
huatuo_bamai_netstat_container_TcpExt_TCPReqQFullDrop{container_host="coredns-855c4dd65d-8v5kg",container_hostnamespace="kube-system",container_level="burstable",container_name="coredns",container_type="normal",host="hostname",region="dev"} 0
# HELP huatuo_bamai_netstat_container_TcpExt_TCPRetransFail statistic TcpExtTCPRetransFail.
# TYPE huatuo_bamai_netstat_container_TcpExt_TCPRetransFail gauge
huatuo_bamai_netstat_container_TcpExt_TCPRetransFail{container_host="coredns-855c4dd65d-8v5kg",container_hostnamespace="kube-system",container_level="burstable",container_name="coredns",container_type="normal",host="hostname",region="dev"} 0
# HELP huatuo_bamai_netstat_container_TcpExt_TCPSACKDiscard statistic TcpExtTCPSACKDiscard.
# TYPE huatuo_bamai_netstat_container_TcpExt_TCPSACKDiscard gauge
huatuo_bamai_netstat_container_TcpExt_TCPSACKDiscard{container_host="coredns-855c4dd65d-8v5kg",container_hostnamespace="kube-system",container_level="burstable",container_name="coredns",container_type="normal",host="hostname",region="dev"} 0
# HELP huatuo_bamai_netstat_container_TcpExt_TCPSACKReneging statistic TcpExtTCPSACKReneging.
# TYPE huatuo_bamai_netstat_container_TcpExt_TCPSACKReneging gauge
huatuo_bamai_netstat_container_TcpExt_TCPSACKReneging{container_host="coredns-855c4dd65d-8v5kg",container_hostnamespace="kube-system",container_level="burstable",container_name="coredns",container_type="normal",host="hostname",region="dev"} 0
# HELP huatuo_bamai_netstat_container_TcpExt_TCPSACKReorder statistic TcpExtTCPSACKReorder.
# TYPE huatuo_bamai_netstat_container_TcpExt_TCPSACKReorder gauge
huatuo_bamai_netstat_container_TcpExt_TCPSACKReorder{container_host="coredns-855c4dd65d-8v5kg",container_hostnamespace="kube-system",container_level="burstable",container_name="coredns",container_type="normal",host="hostname",region="dev"} 0
# HELP huatuo_bamai_netstat_container_TcpExt_TCPSYNChallenge statistic TcpExtTCPSYNChallenge.
# TYPE huatuo_bamai_netstat_container_TcpExt_TCPSYNChallenge gauge
huatuo_bamai_netstat_container_TcpExt_TCPSYNChallenge{container_host="coredns-855c4dd65d-8v5kg",container_hostnamespace="kube-system",container_level="burstable",container_name="coredns",container_type="normal",host="hostname",region="dev"} 0
# HELP huatuo_bamai_netstat_container_TcpExt_TCPSackFailures statistic TcpExtTCPSackFailures.
# TYPE huatuo_bamai_netstat_container_TcpExt_TCPSackFailures gauge
huatuo_bamai_netstat_container_TcpExt_TCPSackFailures{container_host="coredns-855c4dd65d-8v5kg",container_hostnamespace="kube-system",container_level="burstable",container_name="coredns",container_type="normal",host="hostname",region="dev"} 0
# HELP huatuo_bamai_netstat_container_TcpExt_TCPSackMerged statistic TcpExtTCPSackMerged.
# TYPE huatuo_bamai_netstat_container_TcpExt_TCPSackMerged gauge
huatuo_bamai_netstat_container_TcpExt_TCPSackMerged{container_host="coredns-855c4dd65d-8v5kg",container_hostnamespace="kube-system",container_level="burstable",container_name="coredns",container_type="normal",host="hostname",region="dev"} 0
# HELP huatuo_bamai_netstat_container_TcpExt_TCPSackRecovery statistic TcpExtTCPSackRecovery.
# TYPE huatuo_bamai_netstat_container_TcpExt_TCPSackRecovery gauge
huatuo_bamai_netstat_container_TcpExt_TCPSackRecovery{container_host="coredns-855c4dd65d-8v5kg",container_hostnamespace="kube-system",container_level="burstable",container_name="coredns",container_type="normal",host="hostname",region="dev"} 0
# HELP huatuo_bamai_netstat_container_TcpExt_TCPSackRecoveryFail statistic TcpExtTCPSackRecoveryFail.
# TYPE huatuo_bamai_netstat_container_TcpExt_TCPSackRecoveryFail gauge
huatuo_bamai_netstat_container_TcpExt_TCPSackRecoveryFail{container_host="coredns-855c4dd65d-8v5kg",container_hostnamespace="kube-system",container_level="burstable",container_name="coredns",container_type="normal",host="hostname",region="dev"} 0
# HELP huatuo_bamai_netstat_container_TcpExt_TCPSackShiftFallback statistic TcpExtTCPSackShiftFallback.
# TYPE huatuo_bamai_netstat_container_TcpExt_TCPSackShiftFallback gauge
huatuo_bamai_netstat_container_TcpExt_TCPSackShiftFallback{container_host="coredns-855c4dd65d-8v5kg",container_hostnamespace="kube-system",container_level="burstable",container_name="coredns",container_type="normal",host="hostname",region="dev"} 0
# HELP huatuo_bamai_netstat_container_TcpExt_TCPSackShifted statistic TcpExtTCPSackShifted.
# TYPE huatuo_bamai_netstat_container_TcpExt_TCPSackShifted gauge
huatuo_bamai_netstat_container_TcpExt_TCPSackShifted{container_host="coredns-855c4dd65d-8v5kg",container_hostnamespace="kube-system",container_level="burstable",container_name="coredns",container_type="normal",host="hostname",region="dev"} 0
# HELP huatuo_bamai_netstat_container_TcpExt_TCPSlowStartRetrans statistic TcpExtTCPSlowStartRetrans.
# TYPE huatuo_bamai_netstat_container_TcpExt_TCPSlowStartRetrans gauge
huatuo_bamai_netstat_container_TcpExt_TCPSlowStartRetrans{container_host="coredns-855c4dd65d-8v5kg",container_hostnamespace="kube-system",container_level="burstable",container_name="coredns",container_type="normal",host="hostname",region="dev"} 0
# HELP huatuo_bamai_netstat_container_TcpExt_TCPSpuriousRTOs statistic TcpExtTCPSpuriousRTOs.
# TYPE huatuo_bamai_netstat_container_TcpExt_TCPSpuriousRTOs gauge
huatuo_bamai_netstat_container_TcpExt_TCPSpuriousRTOs{container_host="coredns-855c4dd65d-8v5kg",container_hostnamespace="kube-system",container_level="burstable",container_name="coredns",container_type="normal",host="hostname",region="dev"} 0
# HELP huatuo_bamai_netstat_container_TcpExt_TCPSpuriousRtxHostQueues statistic TcpExtTCPSpuriousRtxHostQueues.
# TYPE huatuo_bamai_netstat_container_TcpExt_TCPSpuriousRtxHostQueues gauge
huatuo_bamai_netstat_container_TcpExt_TCPSpuriousRtxHostQueues{container_host="coredns-855c4dd65d-8v5kg",container_hostnamespace="kube-system",container_level="burstable",container_name="coredns",container_type="normal",host="hostname",region="dev"} 0
# HELP huatuo_bamai_netstat_container_TcpExt_TCPSynRetrans statistic TcpExtTCPSynRetrans.
# TYPE huatuo_bamai_netstat_container_TcpExt_TCPSynRetrans gauge
huatuo_bamai_netstat_container_TcpExt_TCPSynRetrans{container_host="coredns-855c4dd65d-8v5kg",container_hostnamespace="kube-system",container_level="burstable",container_name="coredns",container_type="normal",host="hostname",region="dev"} 0
# HELP huatuo_bamai_netstat_container_TcpExt_TCPTSReorder statistic TcpExtTCPTSReorder.
# TYPE huatuo_bamai_netstat_container_TcpExt_TCPTSReorder gauge
huatuo_bamai_netstat_container_TcpExt_TCPTSReorder{container_host="coredns-855c4dd65d-8v5kg",container_hostnamespace="kube-system",container_level="burstable",container_name="coredns",container_type="normal",host="hostname",region="dev"} 0
# HELP huatuo_bamai_netstat_container_TcpExt_TCPTimeWaitOverflow statistic TcpExtTCPTimeWaitOverflow.
# TYPE huatuo_bamai_netstat_container_TcpExt_TCPTimeWaitOverflow gauge
huatuo_bamai_netstat_container_TcpExt_TCPTimeWaitOverflow{container_host="coredns-855c4dd65d-8v5kg",container_hostnamespace="kube-system",container_level="burstable",container_name="coredns",container_type="normal",host="hostname",region="dev"} 0
# HELP huatuo_bamai_netstat_container_TcpExt_TCPTimeouts statistic TcpExtTCPTimeouts.
# TYPE huatuo_bamai_netstat_container_TcpExt_TCPTimeouts gauge
huatuo_bamai_netstat_container_TcpExt_TCPTimeouts{container_host="coredns-855c4dd65d-8v5kg",container_hostnamespace="kube-system",container_level="burstable",container_name="coredns",container_type="normal",host="hostname",region="dev"} 0
# HELP huatuo_bamai_netstat_container_TcpExt_TCPToZeroWindowAdv statistic TcpExtTCPToZeroWindowAdv.
# TYPE huatuo_bamai_netstat_container_TcpExt_TCPToZeroWindowAdv gauge
huatuo_bamai_netstat_container_TcpExt_TCPToZeroWindowAdv{container_host="coredns-855c4dd65d-8v5kg",container_hostnamespace="kube-system",container_level="burstable",container_name="coredns",container_type="normal",host="hostname",region="dev"} 0
# HELP huatuo_bamai_netstat_container_TcpExt_TCPWantZeroWindowAdv statistic TcpExtTCPWantZeroWindowAdv.
# TYPE huatuo_bamai_netstat_container_TcpExt_TCPWantZeroWindowAdv gauge
huatuo_bamai_netstat_container_TcpExt_TCPWantZeroWindowAdv{container_host="coredns-855c4dd65d-8v5kg",container_hostnamespace="kube-system",container_level="burstable",container_name="coredns",container_type="normal",host="hostname",region="dev"} 0
# HELP huatuo_bamai_netstat_container_TcpExt_TCPWinProbe statistic TcpExtTCPWinProbe.
# TYPE huatuo_bamai_netstat_container_TcpExt_TCPWinProbe gauge
huatuo_bamai_netstat_container_TcpExt_TCPWinProbe{container_host="coredns-855c4dd65d-8v5kg",container_hostnamespace="kube-system",container_level="burstable",container_name="coredns",container_type="normal",host="hostname",region="dev"} 0
# HELP huatuo_bamai_netstat_container_TcpExt_TCPWqueueTooBig statistic TcpExtTCPWqueueTooBig.
# TYPE huatuo_bamai_netstat_container_TcpExt_TCPWqueueTooBig gauge
huatuo_bamai_netstat_container_TcpExt_TCPWqueueTooBig{container_host="coredns-855c4dd65d-8v5kg",container_hostnamespace="kube-system",container_level="burstable",container_name="coredns",container_type="normal",host="hostname",region="dev"} 0
# HELP huatuo_bamai_netstat_container_TcpExt_TCPZeroWindowDrop statistic TcpExtTCPZeroWindowDrop.
# TYPE huatuo_bamai_netstat_container_TcpExt_TCPZeroWindowDrop gauge
huatuo_bamai_netstat_container_TcpExt_TCPZeroWindowDrop{container_host="coredns-855c4dd65d-8v5kg",container_hostnamespace="kube-system",container_level="burstable",container_name="coredns",container_type="normal",host="hostname",region="dev"} 0
# HELP huatuo_bamai_netstat_container_TcpExt_TW statistic TcpExtTW.
# TYPE huatuo_bamai_netstat_container_TcpExt_TW gauge
huatuo_bamai_netstat_container_TcpExt_TW{container_host="coredns-855c4dd65d-8v5kg",container_hostnamespace="kube-system",container_level="burstable",container_name="coredns",container_type="normal",host="hostname",region="dev"} 720624
# HELP huatuo_bamai_netstat_container_TcpExt_TWKilled statistic TcpExtTWKilled.
# TYPE huatuo_bamai_netstat_container_TcpExt_TWKilled gauge
huatuo_bamai_netstat_container_TcpExt_TWKilled{container_host="coredns-855c4dd65d-8v5kg",container_hostnamespace="kube-system",container_level="burstable",container_name="coredns",container_type="normal",host="hostname",region="dev"} 0
# HELP huatuo_bamai_netstat_container_TcpExt_TWRecycled statistic TcpExtTWRecycled.
# TYPE huatuo_bamai_netstat_container_TcpExt_TWRecycled gauge
huatuo_bamai_netstat_container_TcpExt_TWRecycled{container_host="coredns-855c4dd65d-8v5kg",container_hostnamespace="kube-system",container_level="burstable",container_name="coredns",container_type="normal",host="hostname",region="dev"} 2461
# HELP huatuo_bamai_netstat_container_TcpExt_TcpDuplicateDataRehash statistic TcpExtTcpDuplicateDataRehash.
# TYPE huatuo_bamai_netstat_container_TcpExt_TcpDuplicateDataRehash gauge
huatuo_bamai_netstat_container_TcpExt_TcpDuplicateDataRehash{container_host="coredns-855c4dd65d-8v5kg",container_hostnamespace="kube-system",container_level="burstable",container_name="coredns",container_type="normal",host="hostname",region="dev"} 0
# HELP huatuo_bamai_netstat_container_TcpExt_TcpTimeoutRehash statistic TcpExtTcpTimeoutRehash.
# TYPE huatuo_bamai_netstat_container_TcpExt_TcpTimeoutRehash gauge
huatuo_bamai_netstat_container_TcpExt_TcpTimeoutRehash{container_host="coredns-855c4dd65d-8v5kg",container_hostnamespace="kube-system",container_level="burstable",container_name="coredns",container_type="normal",host="hostname",region="dev"} 0
Ref:
Socket
# HELP huatuo_bamai_sockstat_container_FRAG_inuse Number of FRAG sockets in state inuse.
# TYPE huatuo_bamai_sockstat_container_FRAG_inuse gauge
huatuo_bamai_sockstat_container_FRAG_inuse{container_host="coredns-855c4dd65d-8v5kg",container_hostnamespace="kube-system",container_level="burstable",container_name="coredns",container_type="normal",host="hostname",region="dev"} 0
# HELP huatuo_bamai_sockstat_container_FRAG_memory Number of FRAG sockets in state memory.
# TYPE huatuo_bamai_sockstat_container_FRAG_memory gauge
huatuo_bamai_sockstat_container_FRAG_memory{container_host="coredns-855c4dd65d-8v5kg",container_hostnamespace="kube-system",container_level="burstable",container_name="coredns",container_type="normal",host="hostname",region="dev"} 0
# HELP huatuo_bamai_sockstat_container_RAW_inuse Number of RAW sockets in state inuse.
# TYPE huatuo_bamai_sockstat_container_RAW_inuse gauge
huatuo_bamai_sockstat_container_RAW_inuse{container_host="coredns-855c4dd65d-8v5kg",container_hostnamespace="kube-system",container_level="burstable",container_name="coredns",container_type="normal",host="hostname",region="dev"} 0
# HELP huatuo_bamai_sockstat_container_TCP_alloc Number of TCP sockets in state alloc.
# TYPE huatuo_bamai_sockstat_container_TCP_alloc gauge
huatuo_bamai_sockstat_container_TCP_alloc{container_host="coredns-855c4dd65d-8v5kg",container_hostnamespace="kube-system",container_level="burstable",container_name="coredns",container_type="normal",host="hostname",region="dev"} 171
# HELP huatuo_bamai_sockstat_container_TCP_inuse Number of TCP sockets in state inuse.
# TYPE huatuo_bamai_sockstat_container_TCP_inuse gauge
huatuo_bamai_sockstat_container_TCP_inuse{container_host="coredns-855c4dd65d-8v5kg",container_hostnamespace="kube-system",container_level="burstable",container_name="coredns",container_type="normal",host="hostname",region="dev"} 1
# HELP huatuo_bamai_sockstat_container_TCP_orphan Number of TCP sockets in state orphan.
# TYPE huatuo_bamai_sockstat_container_TCP_orphan gauge
huatuo_bamai_sockstat_container_TCP_orphan{container_host="coredns-855c4dd65d-8v5kg",container_hostnamespace="kube-system",container_level="burstable",container_name="coredns",container_type="normal",host="hostname",region="dev"} 0
# HELP huatuo_bamai_sockstat_container_TCP_tw Number of TCP sockets in state tw.
# TYPE huatuo_bamai_sockstat_container_TCP_tw gauge
huatuo_bamai_sockstat_container_TCP_tw{container_host="coredns-855c4dd65d-8v5kg",container_hostnamespace="kube-system",container_level="burstable",container_name="coredns",container_type="normal",host="hostname",region="dev"} 75
# HELP huatuo_bamai_sockstat_container_UDPLITE_inuse Number of UDPLITE sockets in state inuse.
# TYPE huatuo_bamai_sockstat_container_UDPLITE_inuse gauge
huatuo_bamai_sockstat_container_UDPLITE_inuse{container_host="coredns-855c4dd65d-8v5kg",container_hostnamespace="kube-system",container_level="burstable",container_name="coredns",container_type="normal",host="hostname",region="dev"} 0
# HELP huatuo_bamai_sockstat_container_UDP_inuse Number of UDP sockets in state inuse.
# TYPE huatuo_bamai_sockstat_container_UDP_inuse gauge
huatuo_bamai_sockstat_container_UDP_inuse{container_host="coredns-855c4dd65d-8v5kg",container_hostnamespace="kube-system",container_level="burstable",container_name="coredns",container_type="normal",host="hostname",region="dev"} 0
# HELP huatuo_bamai_sockstat_container_sockets_used Number of IPv4 sockets in use.
# TYPE huatuo_bamai_sockstat_container_sockets_used gauge
huatuo_bamai_sockstat_container_sockets_used{container_host="coredns-855c4dd65d-8v5kg",container_hostnamespace="kube-system",container_level="burstable",container_name="coredns",container_type="normal",host="hostname",region="dev"} 7
# HELP huatuo_bamai_sockstat_sockets_used Number of IPv4 sockets in use.
# TYPE huatuo_bamai_sockstat_sockets_used gauge
huatuo_bamai_sockstat_sockets_used{host="hostname",region="dev"} 409
| Metric | Description | Unit | Scope | Labels |
|---|---|---|---|---|
| sockstat_sockets_used | Total number of sockets currently in use on the system | count | Host | |
| sockstat_TCP_inuse | Number of TCP sockets in active connection states | count | Host, Container | |
| sockstat_TCP_orphan | Number of TCP sockets without an owning process | count | Host, Container | |
| sockstat_TCP_tw | Number of TCP sockets currently in TIME_WAIT state | count | Host, Container | |
| sockstat_TCP_alloc | Total number of allocated TCP socket objects | count | Host, Container | |
| sockstat_TCP_mem | Number of memory pages currently used by TCP sockets | count | Host |
IO
iolatency tracks disk I/O latency distribution. A simple way to read it is: break one disk request into stages, then count how many requests fall into each latency bucket.
q2c: from entering the queue to completion, covering the full I/O lifecycled2c: from driver dispatch to completion, closer to device-side latencyfreeze: number of disk freeze events
The current version exposes both host-level and container-level metrics.
Queue
These metrics always include the common labels host and region. Container
metrics also always include container_host, container_name,
container_type, container_level, and container_hostnamespace.
# HELP huatuo_bamai_iolatency_blkdisk_d2c the disk d2c latency
# TYPE huatuo_bamai_iolatency_blkdisk_d2c gauge
huatuo_bamai_iolatency_blkdisk_d2c{disk="253:1",host="hostname",region="dev",zone="0"} 3
# HELP huatuo_bamai_iolatency_blkdisk_q2c the disk q2c latency
# TYPE huatuo_bamai_iolatency_blkdisk_q2c gauge
huatuo_bamai_iolatency_blkdisk_q2c{disk="253:1",host="hostname",region="dev",zone="0"} 3
# HELP huatuo_bamai_iolatency_container_blkdisk_d2c container blkio d2c latency
# TYPE huatuo_bamai_iolatency_container_blkdisk_d2c gauge
huatuo_bamai_iolatency_container_blkdisk_d2c{container_host="etcd-hostname",container_hostnamespace="kube-system",container_level="burstable",container_name="etcd",container_type="normal",disk="253:1",host="hostname",region="dev",zone="5"} 2
# HELP huatuo_bamai_iolatency_container_blkdisk_q2c container blkio q2c latency
# TYPE huatuo_bamai_iolatency_container_blkdisk_q2c gauge
huatuo_bamai_iolatency_container_blkdisk_q2c{container_host="etcd-hostname",container_hostnamespace="kube-system",container_level="burstable",container_name="etcd",container_type="normal",disk="253:1",host="hostname",region="dev",zone="5"} 2
| Metric | Description | Unit | Scope | Labels |
|---|---|---|---|---|
| iolatency_blkdisk_q2c | Host disk latency statistics for the full I/O lifecycle, from queueing to completion. Buckets: zone0 20-30ms, zone1 30-50ms, zone2 50-100ms, zone3 100-200ms, zone4 200-400ms, zone5 400ms+ | count | Host | host, region, disk, zone |
| iolatency_blkdisk_d2c | Host disk latency statistics from driver dispatch to completion, closer to device processing time. Buckets: zone0 20-30ms, zone1 30-50ms, zone2 50-100ms, zone3 100-200ms, zone4 200-400ms, zone5 400ms+ | count | Host | host, region, disk, zone |
| iolatency_container_blkdisk_q2c | Container-caused latency statistics for the full I/O lifecycle, from queueing to completion. Buckets: zone0 20-30ms, zone1 30-50ms, zone2 50-100ms, zone3 100-200ms, zone4 200-400ms, zone5 400ms+ | count | Container | host, region, container_host, container_name, container_type, container_level, container_hostnamespace, zone |
| iolatency_container_blkdisk_d2c | Container-caused latency statistics from driver dispatch to completion. Buckets: zone0 20-30ms, zone1 30-50ms, zone2 50-100ms, zone3 100-200ms, zone4 200-400ms, zone5 400ms+ | count | Container | host, region, container_host, container_name, container_type, container_level, container_hostnamespace, zone |
Hardware
# HELP huatuo_bamai_iolatency_blkdisk_freeze the disk freeze event count
# TYPE huatuo_bamai_iolatency_blkdisk_freeze gauge
huatuo_bamai_iolatency_blkdisk_freeze{disk="253:1",host="hostname",region="dev"} 0
| Metric | Description | Unit | Scope | Labels |
|---|---|---|---|---|
| iolatency_blkdisk_freeze | Host disk freeze event count | count | Host | host, region, disk |
Disk IO Statistics
diskio collects per-device disk IO metrics and system-wide CPU iowait by reading /proc/diskstats and /proc/stat. Unlike iolatency, diskio is procfs-based rather than eBPF-based, providing cumulative counters that support rate-based latency calculations.
The default configuration disables this collector through BlackList. Remove
diskio from BlackList to enable these metrics.
Counter metrics are cumulative; use Prometheus rate() for per-second values (IOPS, throughput). Gauge metrics are point-in-time values. Average latency is computed in PromQL by dividing the I/O time rate by the request rate.
# HELP huatuo_bamai_diskio_read_requests_total Total number of read requests completed successfully.
# TYPE huatuo_bamai_diskio_read_requests_total counter
huatuo_bamai_diskio_read_requests_total{device="sda",host="hostname",region="dev"} 1000
# HELP huatuo_bamai_diskio_write_requests_total Total number of write requests completed successfully.
# TYPE huatuo_bamai_diskio_write_requests_total counter
huatuo_bamai_diskio_write_requests_total{device="sda",host="hostname",region="dev"} 2000
# HELP huatuo_bamai_diskio_read_bytes_total Total number of bytes read from the device.
# TYPE huatuo_bamai_diskio_read_bytes_total counter
huatuo_bamai_diskio_read_bytes_total{device="sda",host="hostname",region="dev"} 2.56e+07
# HELP huatuo_bamai_diskio_written_bytes_total Total number of bytes written to the device.
# TYPE huatuo_bamai_diskio_written_bytes_total counter
huatuo_bamai_diskio_written_bytes_total{device="sda",host="hostname",region="dev"} 4.096e+07
# HELP huatuo_bamai_diskio_io_in_progress Number of I/O requests currently in flight (queue depth).
# TYPE huatuo_bamai_diskio_io_in_progress gauge
huatuo_bamai_diskio_io_in_progress{device="sda",host="hostname",region="dev"} 50
# HELP huatuo_bamai_diskio_read_time_seconds_total Total seconds spent by completed read requests.
# TYPE huatuo_bamai_diskio_read_time_seconds_total counter
huatuo_bamai_diskio_read_time_seconds_total{device="sda",host="hostname",region="dev"} 3
# HELP huatuo_bamai_diskio_write_time_seconds_total Total seconds spent by completed write requests.
# TYPE huatuo_bamai_diskio_write_time_seconds_total counter
huatuo_bamai_diskio_write_time_seconds_total{device="sda",host="hostname",region="dev"} 6
# HELP huatuo_bamai_diskio_disk_iowait_percent CPU time spent waiting for I/O during the collection interval.
# TYPE huatuo_bamai_diskio_disk_iowait_percent gauge
huatuo_bamai_diskio_disk_iowait_percent{host="hostname",region="dev"} 50
| Metric | Description | Unit | Scope | Labels |
|---|---|---|---|---|
| read_requests_total | Cumulative read requests completed (field 4). Use rate() for read IOPS |
count | Host | host, region, device |
| write_requests_total | Cumulative write requests completed (field 8). Use rate() for write IOPS |
count | Host | host, region, device |
| read_bytes_total | Cumulative bytes read (field 6 × 512). Use rate() for read throughput |
bytes | Host | host, region, device |
| written_bytes_total | Cumulative bytes written (field 10 × 512). Use rate() for write throughput |
bytes | Host | host, region, device |
| read_time_seconds_total | Cumulative seconds spent by completed reads (field 7) | seconds | Host | host, region, device |
| write_time_seconds_total | Cumulative seconds spent by completed writes (field 11) | seconds | Host | host, region, device |
| io_in_progress | Current number of I/O requests in flight, i.e. queue depth (field 12) | count | Host | host, region, device |
| disk_iowait_percent | CPU time spent waiting for I/O during the collection interval | percent | Host | host, region |
XFS Filesystem Statistics
xfs collects per-device statistics from sysfs. Metrics use the
huatuo_bamai_xfs_ prefix and device, host, region labels.
log_free_bytes is a gauge; _total metrics are cumulative counters.
| Metric suffix | Description | Unit |
|---|---|---|
| log_free_bytes | Available log space | bytes |
| log_space_sleep_total | Cumulative waits for log space | count |
| alloc_blocks_total | Cumulative allocated blocks | blocks |
| alloc_extents_total | Cumulative allocated extents | count |
| inode_attempts_total | Cumulative inode cache requests | count |
| inode_missed_total | Cumulative inode cache misses | count |
| buf_busy_locked_total | Cumulative busy-locked buffer events | count |
| buf_locked_waited_total | Cumulative waits for buffer locks | count |
log_free_bytes is omitted when log-space information is unavailable.
Restart the daemon after adding XFS mounts.
General System
Soft Lockup
# HELP huatuo_bamai_softlockup_total softlockup counter
# TYPE huatuo_bamai_softlockup_total counter
huatuo_bamai_softlockup_total{host="hostname",region="dev"} 0
| Metric | Description | Unit | Target | Source | Labels |
|---|---|---|---|---|---|
| softlockup_total | Count of soft lockup events | count | Host | BPF |
HungTask
# HELP huatuo_bamai_hungtask_total hungtask counter
# TYPE huatuo_bamai_hungtask_total counter
huatuo_bamai_hungtask_total{host="hostname",region="dev"} 0
| Metric | Description | Unit | Target | Source | Labels |
|---|---|---|---|---|---|
| hungtask_total | Count of hung task events | count | Host | BPF |
GPU
- MetaX
| Metric | Description | Unit | Target | Source |
|---|---|---|---|---|
| metax_gpu_sdk_info | GPU SDK info. | - | version | sml.GetSDKVersion |
| metax_gpu_driver_info | GPU driver info. | - | version | sml.GetGPUVersion with driver unit |
| metax_gpu_info | GPU info. | - | gpu, model, uuid, bios_version, bdf, mode, die_count | sml.GetGPUInfo |
| metax_gpu_board_power_watts | GPU board power. | W | gpu | sml.ListGPUBoardWayElectricInfos |
| metax_gpu_pcie_link_speed_gt_per_second | GPU PCIe current link speed. | GT/s | gpu | sml.GetGPUPcieLinkInfo |
| metax_gpu_pcie_link_width_lanes | GPU PCIe current link width. | lanes | gpu | sml.GetGPUPcieLinkInfo |
| metax_gpu_pcie_receive_bytes_per_second | GPU PCIe receive throughput. | B/s | gpu | sml.GetGPUPcieThroughputInfo |
| metax_gpu_pcie_transmit_bytes_per_second | GPU PCIe transmit throughput. | B/s | gpu | sml.GetGPUPcieThroughputInfo |
| metax_gpu_metaxlink_link_speed_gt_per_second | GPU MetaXLink current link speed. | GT/s | gpu, metaxlink | sml.ListGPUMetaXLinkLinkInfos |
| metax_gpu_metaxlink_link_width_lanes | GPU MetaXLink current link width. | lanes | gpu, metaxlink | sml.ListGPUMetaXLinkLinkInfos |
| metax_gpu_metaxlink_receive_bytes_per_second | GPU MetaXLink receive throughput. | B/s | gpu, metaxlink | sml.ListGPUMetaXLinkThroughputInfos |
| metax_gpu_metaxlink_transmit_bytes_per_second | GPU MetaXLink transmit throughput. | B/s | gpu, metaxlink | sml.ListGPUMetaXLinkThroughputInfos |
| metax_gpu_metaxlink_receive_bytes_total | GPU MetaXLink receive data size. | bytes | gpu, metaxlink | sml.ListGPUMetaXLinkTrafficStatInfos |
| metax_gpu_metaxlink_transmit_bytes_total | GPU MetaXLink transmit data size. | bytes | gpu, metaxlink | sml.ListGPUMetaXLinkTrafficStatInfos |
| metax_gpu_metaxlink_aer_errors_total | GPU MetaXLink AER errors count. | count | gpu, metaxlink, error_type | sml.ListGPUMetaXLinkAerErrorsInfos |
| metax_gpu_status | GPU status, 0 means normal, other values means abnormal. Check the documentation to see the exceptions corresponding to each value. | - | gpu, die | sml.GetDieStatus |
| metax_gpu_temperature_celsius | GPU temperature. | °C | gpu, die | sml.GetDieTemperature |
| metax_gpu_utilization_percent | GPU utilization, ranging from 0 to 100. | % | gpu, die, ip | sml.GetDieUtilization |
| metax_gpu_memory_total_bytes | Total vram. | bytes | gpu, die | sml.GetDieMemoryInfo |
| metax_gpu_memory_used_bytes | Used vram. | bytes | gpu, die | sml.GetDieMemoryInfo |
| metax_gpu_clock_mhz | GPU clock. | MHz | gpu, die, ip | sml.ListDieClocks |
| metax_gpu_clocks_throttling | Reason(s) for GPU clocks throttling. | - | gpu, die, reason | sml.GetDieClocksThrottleStatus |
| metax_gpu_dpm_performance_level | GPU DPM performance level. | - | gpu, die, ip | sml.GetDieDPMPerformanceLevel |
| metax_gpu_ecc_memory_errors_total | GPU ECC memory errors count. | count | gpu, die, memory_type, error_type | sml.GetDieECCMemoryInfo |
| metax_gpu_ecc_memory_retired_pages_total | GPU ECC memory retired pages count. | count | gpu, die | sml.GetDieECCMemoryInfo |
- Moore Threads (MThreads)
MThreads GPU monitoring via the MTML (Moore Threads Management Library). The library is discovered automatically at startup using SONAME search (libmtml.so.2 then libmtml.so) through the system dynamic linker. Static device info is cached and only rebuilt on re-init; dynamic metrics are collected on every scrape.
Configuration: remove mthreads_gpu from BlackList to enable. Metric groups are controlled by [MetricCollector.Mthreads] toggles (EnableHealth, EnablePCIe, EnableMTLink).
| Metric | Description | Unit | Labels | Source |
|---|---|---|---|---|
| huatuo_bamai_mthreads_gpu_library_info | MTML library info. | - | version | mtml.LibraryVersion |
| huatuo_bamai_mthreads_gpu_device_info | GPU info. | - | gpu, name, brand, serial | mtml.Device.Name/Brand/SerialNumber |
| huatuo_bamai_mthreads_gpu_device_pci_info | GPU PCI info. | - | gpu, sbdf | mtml.Device.PciSbdf |
| huatuo_bamai_mthreads_gpu_device_spec | GPU spec. | - | gpu, cores | mtml.Device.GpuCores |
| huatuo_bamai_mthreads_gpu_device_bios_version | GPU BIOS version. | - | gpu, bios | mtml.Device.BiosVersion |
| huatuo_bamai_mthreads_gpu_device_musa_capability | GPU MUSA compute capability. | - | gpu, musa_capability | mtml.Device.MusaComputeCapability |
| huatuo_bamai_mthreads_gpu_memory_info | GPU memory info. | - | gpu, type, vendor, bus_width | mtml.Device.InitMemory |
| huatuo_bamai_mthreads_gpu_pcie_link_max_speed_gt_per_sec | GPU PCIe max link speed in GT/s (hardware capability). | GT/s | gpu | mtml.Device.PciInfo |
| huatuo_bamai_mthreads_gpu_pcie_link_max_width_lanes | GPU PCIe max link width in lanes (hardware capability). | lanes | gpu | mtml.Device.PciInfo |
| huatuo_bamai_mthreads_gpu_device_power_watts | GPU device power in watts. | W | gpu | mtml.Device.PowerUsage |
| huatuo_bamai_mthreads_gpu_gpu_temperature_celsius | GPU temperature. | °C | gpu | mtml.Gpu.Temperature |
| huatuo_bamai_mthreads_gpu_memory_temperature_celsius | GPU memory temperature. | °C | gpu | mtml.Memory.Temperature |
| huatuo_bamai_mthreads_gpu_gpu_utilization_percent | GPU utilization (0-100). | % | gpu | mtml.Gpu.Utilization |
| huatuo_bamai_mthreads_gpu_memory_utilization_percent | GPU memory utilization (0-100). | % | gpu | mtml.Memory.Utilization |
| huatuo_bamai_mthreads_gpu_memory_total_bytes | Total GPU memory in bytes. | bytes | gpu | mtml.Memory.Total |
| huatuo_bamai_mthreads_gpu_memory_used_bytes | Used GPU memory in bytes. | bytes | gpu | mtml.Memory.Used |
| huatuo_bamai_mthreads_gpu_gpu_clock_mhz | GPU clock in MHz. | MHz | gpu | mtml.Gpu.Clock |
| huatuo_bamai_mthreads_gpu_gpu_max_clock_mhz | GPU max clock in MHz. | MHz | gpu | mtml.Gpu.MaxClock |
| huatuo_bamai_mthreads_gpu_memory_clock_mhz | GPU memory clock in MHz. | MHz | gpu | mtml.Memory.Clock |
| huatuo_bamai_mthreads_gpu_memory_max_clock_mhz | GPU memory max clock in MHz. | MHz | gpu | mtml.Memory.MaxClock |
| huatuo_bamai_mthreads_gpu_gpu_voltage_volts | GPU voltage in volts. | V | gpu | mtml.Gpu.Voltage |
| huatuo_bamai_mthreads_gpu_gpu_power_limit_watts | GPU enforced power limit in watts. | W | gpu | mtml.Gpu.EnforcedPowerLimit |
| huatuo_bamai_mthreads_gpu_gpu_power_default_limit_watts | GPU default power management limit in watts. | W | gpu | mtml.Gpu.PowerManagementDefaultLimit |
| huatuo_bamai_mthreads_gpu_fan_rpm | GPU fan speed in RPM. | RPM | gpu, fan | mtml.Device.FanRpm |
| huatuo_bamai_mthreads_gpu_fan_speed_percent | GPU fan speed percent. | % | gpu, fan | mtml.Device.FanSpeed |
| huatuo_bamai_mthreads_gpu_gpu_pstate | GPU performance state (0=P0). | - | gpu | mtml.Device.PerformanceState |
| huatuo_bamai_mthreads_gpu_vpu_utilization_percent | GPU VPU utilization (0-100). | % | gpu | mtml.Vpu.Utilization |
| huatuo_bamai_mthreads_gpu_vpu_encoder_utilization_percent | GPU VPU encoder utilization (0-100). | % | gpu | mtml.Vpu.Utilization |
| huatuo_bamai_mthreads_gpu_vpu_decoder_utilization_percent | GPU VPU decoder utilization (0-100). | % | gpu | mtml.Vpu.Utilization |
| huatuo_bamai_mthreads_gpu_vpu_clock_mhz | GPU VPU clock in MHz. | MHz | gpu | mtml.Vpu.Clock |
| huatuo_bamai_mthreads_gpu_pcie_link_speed_gt_per_sec | GPU PCIe current link speed in GT/s. | GT/s | gpu | mtml.Device.PciInfo |
| huatuo_bamai_mthreads_gpu_pcie_link_width_lanes | GPU PCIe current link width in lanes. | lanes | gpu | mtml.Device.PciInfo |
| huatuo_bamai_mthreads_gpu_pcie_replay_total | GPU PCIe replay counter. | count | gpu | mtml.Device.PcieReplayCounter |
| huatuo_bamai_mthreads_gpu_mtlink_state | GPU MtLink state (0=DOWN,1=UP,2=DOWNGRADE). | - | gpu, link | mtml.Device.MtLinkState |
| huatuo_bamai_mthreads_gpu_mtlink_link_bandwidth_gb_s | GPU MtLink per-link max bandwidth (device static spec, not live throughput). | GB/s | gpu | mtml.Device.MtLinkSpec |
| huatuo_bamai_mthreads_gpu_mtlink_link_count | GPU MtLink max number of supported links (device static spec). | links | gpu | mtml.Device.MtLinkSpec |
2 - Instant Observability
📖 Overview
HUATUO uses eBPF technology to observe anomalous events in real time across core Linux kernel subsystems, including CPU scheduling, memory management, the network protocol stack, and hardware error reporting. When the kernel encounters anomalies such as softlockup, OOM, or hardware MCE errors, eBPF programs hook into kernel functions (kprobes) or kernel tracepoints, capturing process information, kernel call stacks, and network context at the moment the event occurs. The data is passed to user-space handlers via the perf event ring buffer and persisted to Elasticsearch or local disk files.
Compared to traditional kernel log (dmesg/syslog) collection, eBPF-based event observation reduces the risk of data loss from log buffer overflow; it can capture transient anomalies that never appear in kernel logs (such as excessive scheduler tick intervals); and it provides container-level event correlation for precise root-cause analysis in cloud-native environments.
Twelve event types are continuously observed, covering CPU scheduling health (sched_tick, softlockup, hungtask), memory pressure (memory_oom_kill, memory_reclaim_events), the network protocol stack (dropwatch, tcp_retransmit, net_rx_latency, netdev_events, netdev_bonding_lacp, netdev_txqueue_timeout), and hardware reliability (ras).
🎯 Use Cases
Kubernetes Container Memory Fault Diagnosis: In scenarios where containers frequently restart due to OOM, the memory_oom_kill event records both the process killed by the OOM Killer (victim) and the process that triggered the OOM (trigger), including their memcg cgroup pointers and container IDs. Combined with time-series data, this enables fast root-cause analysis of containers involved in memory contention, reducing the time spent manually reviewing container logs.
AI Training Cluster Hardware Fault Detection: On GPU training servers, the ras event continuously collects MCE (Machine Check Exception), EDAC memory controller errors, and PCIe AER (Advanced Error Reporting) errors, classifying them by severity (Corrected / UncorrectedRecoverable / UncorrectedFatal). This enables early detection of hardware aging or single-point failures before training jobs are interrupted, reducing training task losses caused by hardware faults.
Network Performance Jitter Analysis: dropwatch observes packet drops in the kernel network stack, tcp_retransmit observes TCP retransmission activity, and net_rx_latency detects end-to-end receive-path latency for individual packets from the network card driver to user space. Separate thresholds are configured per stage (driver to kernel: 5ms, kernel to TCP: 10ms, TCP to user space: 115ms), precisely identifying which network layer causes business timeouts.
Host Scheduling Health Observation: The sched_tick (scheduler tick interval, default threshold 10ms), softlockup (CPU unable to schedule, ~1 second), and hungtask (D-state process hang) events jointly cover anomalies along the CPU scheduling path. When system stalls or response timeouts occur, kernel call stacks and other diagnostic data are automatically preserved, supporting offline analysis after the fault clears.
🚀 Usage
Configuration
All events provide default values and are operational without any configuration. The following parameters can be tuned as needed:
| Parameter | Default | Description |
|---|---|---|
sched_tick.interval_threshold |
10000000 (10ms, nanoseconds) |
Scheduler tick interval threshold |
memory_reclaim.blocked_threshold |
900000000 (900ms, nanoseconds) |
Direct memory reclaim time trigger threshold |
net_rx_latency.driver2net_rx |
5 (ms) |
Latency threshold from NIC driver to __netif_receive_skb |
net_rx_latency.driver2tcp |
10 (ms) |
Latency threshold from NIC driver to tcp_v4_rcv |
net_rx_latency.driver2userspace |
115 (ms) |
Latency threshold from NIC driver to user-space copy (skb_copy_datagram_iovec) |
net_rx_latency.excluded_host_netnamespace |
true |
Whether to exclude the host network namespace (observe containers only by default) |
net_rx_latency.excluded_container_qos |
[] |
List of container QoS levels to exclude |
dropwatch.filter |
tcp |
tcpdump-style packet filter applied before dropwatch events are emitted |
dropwatch.max_events_per_second |
100 |
Maximum dropwatch events emitted per second; 0 disables rate limiting |
dropwatch.exclude_containers |
[] |
Reserved field; the current dropwatch event path does not apply it |
netdev.device_list |
[] |
List of network device names to monitor for link state changes |
ras.mce_thr_backoff |
1800 (seconds) |
MCE threshold interrupt (THR) event reporting cooldown to suppress interrupt storms |
issues_list |
[] |
Known-issue suppression rules; matched against net_rx_latency titles and dropwatch kernel call stacks |
Supported Events
| Event Name (tracer_name) | Probe Type | Trigger Condition | Typical Scenarios |
|---|---|---|---|
sched_tick |
kprobe | Scheduler tick interval >= threshold (default 10ms) | System stalls, network latency, scheduling delays |
softlockup |
kprobe | CPU unable to schedule for extended time (~1 second) | Soft lockup, response anomalies |
hungtask |
kprobe | D-state process task hang | Transient mass D-state processes, IO blocking |
memory_oom_kill |
kprobe | OOM Killer triggered | Container/host memory exhaustion |
memory_reclaim_events |
kprobe | Container process direct reclaim time > threshold (default 900ms) | Business stalls caused by memory pressure |
ras |
tracepoint | CPU/MEM/PCIe hardware errors | Hardware fault detection |
dropwatch |
tracepoint | Kernel network stack packet drop | Business jitter caused by protocol stack drops |
tcp_retransmit |
tracepoint; optional kprobe for TLP | TCP retransmission or Tail Loss Probe | TCP loss, reordering, congestion, and latency diagnosis |
net_rx_latency |
kprobe | Protocol stack receive latency exceeds per-stage threshold | Business timeouts caused by receive latency |
netdev_events |
netlink | NIC link state change | Physical NIC link failures |
netdev_bonding_lacp |
kprobe | LACP protocol state change (IEEE 802.3ad mode only) | Fault boundary between physical machines and switches |
netdev_txqueue_timeout |
kprobe | NIC transmit queue timeout | NIC transmit queue hardware failure |
For tcp_retransmit usage, fields, classification, and drop correlation, refer to the tcpshark documentation.
Fields
All event records include the following common fields:
- hostname: Physical machine hostname
- region: Availability zone where the physical machine is located
- uploaded_timestamp: Data upload time
- container_id: Container ID if the event is associated with a container
- container_hostname: Container hostname if the event is associated with a container
- container_host_namespace: Kubernetes namespace of the container if the event is associated with a container
- container_type: Container type, e.g.,
normalfor regular containers,sidecarfor sidecar containers - container_qos: Container QoS level
- tracer_name: Event name (e.g.,
sched_tick,memory_oom_kill) - tracer_id: Tracing ID for this event
- observed_timestamp: Time when the tracing was triggered
- tracer_type: Observation kind; instant event records use
event - tracer_data: Event-specific private data (see individual event descriptions below)
1. sched_tick
Description Measures the interval between scheduler ticks. When the interval reaches the threshold, it records the current kernel call stack and process information. The event can reveal long IRQ-off sections, CPU stalls, or virtualization scheduling delays, but does not by itself prove that softirqs were disabled. comm and pid identify the task interrupted by the reporting tick; they do not identify the cause of the delay.
Applicable Scenarios
- The kernel or a driver disables local interrupts for too long, or hardirq/NMI processing monopolizes the CPU.
- A VM vCPU is descheduled by the host, including high steal time and scheduling stalls.
- Low-level anomalies such as SMI or firmware stalls, delayed clockevent delivery, or lost timer events.
Usage Boundaries Normal tick suppression after a successful NO_HZ transition is excluded. Ordinary CPU load or a softirq backlog alone does not imply tick delay. Set the threshold above the target system’s normal tick period. The captured stack represents the first tick after the delay and should be correlated with IRQ, steal-time, and hardware metrics.
Data Storage Event data is automatically stored in Elasticsearch or as files on the physical machine disk.
Sample Data
{
    "uploaded_timestamp": "2025-06-11T16:05:16.251152703+08:00",
    "hostname": "***",
    "tracer_data": {
        "tick_interval_ns": 237328905,
        "tick_interval_threshold_ns": 10000000,
        "comm": "***-agent",
        "pid": 688073,
        "cpu": 1,
        "stack": "scheduler_tick/..."
    },
    "observed_timestamp": "2025-06-11T16:05:16.251+08:00",
    "tracer_type": "event",
    "region": "***",
    "tracer_name": "sched_tick"
}
Fields
- comm: Name of the process that triggered the event
- stack: Kernel call stack captured on the first scheduler tick after the delay
- tick_interval_ns: Total interval between adjacent scheduler ticks (nanoseconds)
- cpu: CPU number where the event occurred
- tick_interval_threshold_ns: Inclusive scheduler tick interval threshold (nanoseconds)
- pid: Process ID of the task interrupted by the reporting tick
2. dropwatch
Description Detects packet drop behavior in the kernel network protocol stack. Outputs the kernel call stack, network 5-tuple, and TCP state at the time of the drop. Optional call-stack filters can suppress locally validated noise patterns. The type field is reserved for TCP drop-type compatibility and is currently unset.
Data Storage Automatically stored in Elasticsearch or as files on the physical machine disk.
Sample Data
{
    "observed_timestamp": "2026-07-23T02:14:40.304775546Z",
    "tracer_data": {
        "drop_reason": "SKB_DROP_REASON_NOT_SPECIFIED",
        "source": "events",
        "comm": "kubelet",
        "pid": 1687046,
        "net_namespace_cookie": 123456789,
        "net_namespace_inum": 402653184,
        "netdev_queue_mapping": 3,
        "netdev_linkstatus": ["linkStatusUp"],
        "netdev_name": "eth0",
        "netdev_ifindex": 2,
        "packet_eth_proto": "0x0800",
        "packet_len_bytes": 1460,
        "layers": {
            "label": "IPv4/TCP",
            "ipv4": {
                "saddr": "10.79.68.62",
                "daddr": "10.134.72.4",
                "protocol": "TCP"
            },
            "tcp": {
                "sport": 8080,
                "dport": 49000,
                "seq": 1009085774,
                "ack_seq": 689410995,
                "sk_state": "ESTABLISHED"
            }
        },
        "stack": "kfree_skb/..."
    }
}
Fields
- type: Reserved drop type, currently unset and omitted from JSON; reserved codes are
1(common drop),2(SYN flood),3(SYN queue overflow), and4(accept queue overflow) - drop_reason: Kernel packet-drop reason
- source: Event source (
toolsfor standalone dropwatch oreventswhen launched by huatuo-bamai) - comm: Name of the process that triggered the packet drop
- pid: Process ID
- net_namespace_cookie / net_namespace_inum: Network namespace values used for container resolution
- netdev_queue_mapping: NIC queue index
- netdev_linkstatus: List of NIC link status flags
- netdev_name: Network device name
- netdev_ifindex: Network interface index
- packet_len_bytes: Packet length (bytes)
- layers.ipv4.saddr / layers.ipv4.daddr: Source and destination IP addresses
- layers.tcp.sport / layers.tcp.dport: Source and destination ports
- layers.tcp.seq / layers.tcp.ack_seq: TCP sequence and acknowledgment sequence numbers
- layers.tcp.sk_state: TCP connection state at the time of the drop
- stack: Kernel call stack at the time of the drop
3. net_rx_latency
Description Detects latency events on the protocol stack receive path (NIC driver → kernel protocol stack → user-space receive). Three observation points are set along the receive path; when the latency of any stage exceeds the corresponding threshold (defaults: driver to kernel 5ms, kernel to TCP 10ms, TCP to user space 115ms), the event is recorded with the network 5-tuple, TCP sequence number, latency stage, and latency duration. All TCP states are observed, not limited to ESTABLISHED—receive latency events in SYN, FIN, TIME_WAIT, and other non-ESTABLISHED states are also captured. The host network namespace is excluded by default, observing only container network traffic.
Data Storage Automatically stored in Elasticsearch or as files on the physical machine disk.
Sample Data
{
    "observed_timestamp": "2025-06-11T00:00:00Z",
    "tracer_data": {
        "comm": "nginx",
        "pid": 2921092,
        "latency_stage": "RX_STAGE_USERCOPY",
        "latency_ms": 95973,
        "latency_threshold_ms": 115,
        "tcp_state": "ESTABLISHED",
        "tcp_saddr": "10.156.248.76",
        "tcp_daddr": "10.134.72.4",
        "tcp_sport": 9213,
        "tcp_dport": 49000,
        "tcp_seq": 1009085774,
        "tcp_ack_seq": 689410995,
        "net_namespace_cookie": 123456789,
        "net_namespace_inum": 402653184,
        "packet_len_bytes": 26064
    }
}
Fields
- comm: Name of the process that triggered the event
- pid: Process ID that triggered the event
- latency_stage: Stage where latency occurred (
RX_STAGE_NETIFdriver-to-kernel /RX_STAGE_TCPV4kernel-to-TCP /RX_STAGE_USERCOPYTCP-to-user-space) - latency_ms: Actual latency (milliseconds)
- latency_threshold_ms: Latency threshold that triggered the event (milliseconds)
- tcp_state: TCP connection state (all states are supported, e.g.,
ESTABLISHED,SYN_SENT,FIN_WAIT,TIME_WAIT) - tcp_saddr / tcp_daddr: Source IP / Destination IP address
- tcp_sport / tcp_dport: Source port / Destination port
- tcp_seq / tcp_ack_seq: TCP sequence number / Acknowledgment sequence number
- net_namespace_cookie: Network namespace cookie (available on kernel ≥ 5.14, used for efficient container association)
- net_namespace_inum: Network namespace inum
- packet_len_bytes: Packet length (bytes)
4. memory_oom_kill
The OOM kill tracer is named memory_oom_kill (previously memory_oom, and earlier oom). Update blacklist entries, event filters, and alert queries. Its metric prefix is now huatuo_bamai_memory_oom_kill_, replacing huatuo_bamai_memory_oom_ and the earlier huatuo_bamai_oom_; update metric dashboards and recording rules too. Previously stored events keep their original names. Queries spanning these versions must match all three names; the bundled event dashboard does so.
Description Detects OOM (Out of Memory) events on the host or inside containers. Records information about the process killed by the OOM Killer (victim) and the process that triggered the OOM (trigger), along with the corresponding container and memory cgroup details, providing a complete fault snapshot. Host-level and per-container OOM count metrics are also maintained.
Data Storage Automatically stored in Elasticsearch or as files on the physical machine disk.
Sample Data
{
    "tracer_data": {
        "trigger_memcg_css": "0xff4b8d8be3818000",
        "trigger_container_id": "***",
        "trigger_container_hostname": "***.docker",
        "trigger_pid": 3218804,
        "trigger_process_name": "java",
        "victim_memcg_css": "0xff4b8d8be3818000",
        "victim_container_id": "***",
        "victim_container_hostname": "***.docker",
        "victim_pid": 3218745,
        "victim_process_name": "java",
        "cgroup_memory_limit": 2147483648,
        "cgroup_memory_usage": 2143289344,
        "memory_snapshot": {
            "top_processes": [
                {
                    "pid": 3218745,
                    "process_name": "java",
                    "vm_rss": 1604321280,
                    "rss_anon": 1509949440,
                    "rss_file": 83886080,
                    "rss_shmem": 0,
                    "vm_swap": 0,
                    "total": 1593835520
                }
            ],
            "host_meminfo": {
                "MemAvailable": 3355443200,
                "Cached": 1073741824,
                "Slab": 268435456
            },
            "victim_cgroup": {
                "container_id": "***",
                "cgroup_path": "kubepods.slice/...",
                "current": 2143289344,
                "max": 2147483648,
                "stat": {
                    "anon": 1509949440,
                    "file": 83886080
                },
                "events": {
                    "oom": 1,
                    "oom_kill": 1
                }
            }
        }
    }
}
Fields
- victim_process_name / victim_pid: Name and PID of the process killed by the OOM Killer
- victim_container_hostname / victim_container_id: Hostname and container ID where the killed process resided
- victim_memcg_css: Memory cgroup pointer (hex) of the killed process
- trigger_process_name / trigger_pid: Name and PID of the process that triggered OOM
- trigger_container_hostname / trigger_container_id: Hostname and container ID where the triggering process resided
- trigger_memcg_css: Memory cgroup pointer (hex) of the triggering process
- cgroup_memory_limit / cgroup_memory_usage: Memory limit and usage reported by the kernel event
- memory_snapshot.top_processes: Top processes by RSS/swap at the OOM moment, including
RssAnon,RssFile,RssShmem,VmRSS, andVmSwap - memory_snapshot.host_meminfo: Key host
/proc/meminfovalues, such asMemAvailable,Cached,Slab, swap, and anon/file activity - memory_snapshot.trigger_cgroup / victim_cgroup: Trigger/victim container cgroup path, current/max memory,
memory.stat, andmemory.events
5. softlockup
Description Detects softlockup events (CPU unable to be scheduled for an extended period, approximately 1 second). Provides information about the target process causing the lockup, the CPU where it occurred, and NMI backtrace information for all CPUs. A backoff strategy is applied: the reporting interval increases from 10 minutes up to a maximum of 3 hours during an event storm to prevent duplicate reports. A softlockup occurrence counter metric is also maintained.
Data Storage Automatically stored in Elasticsearch or as files on the physical machine disk.
Sample Data
{
    "tracer_data": {
        "cpu": 15,
        "pid": 12345,
        "comm": "kworker/15:0",
        "cpus_stack": "2025-06-10 14:30:22 sysrq: Show backtrace of all active CPUs\nNMI backtrace for cpu 15\n..."
    }
}
Fields
- cpu: CPU number where the softlockup occurred
- pid: PID of the process that triggered the softlockup
- comm: Name of the process that triggered the softlockup
- cpus_stack: NMI backtrace for all CPUs (multi-line text containing timestamps and call stacks)
6. hungtask
Description Detects hungtask events. Captures the kernel stacks of all processes in D state (uninterruptible sleep) and NMI backtrace for all CPUs to preserve the fault scene. A backoff strategy is applied: the reporting interval increases from 10 minutes up to a maximum of 3 hours during an event storm. A hungtask occurrence counter metric is also maintained. Note: some Linux distributions (e.g., Fedora 42) disable hungtask detection by default, in which case this observer will not start.
Data Storage Automatically stored in Elasticsearch or as files on the physical machine disk.
Sample Data
{
    "tracer_data": {
        "tid": 2567042,
        "comm": "kworker/u48:2",
        "cpus_stack": "2025-06-10 09:57:14 sysrq: Show backtrace of all active CPUs\nNMI backtrace for cpu 33\n...",
        "blocked_processes_stack": "task:java            state:D stack:    0 pid: 12345 ..."
    }
}
Fields
- tid: TID of the task that triggered hungtask detection
- comm: Name of the task that triggered hungtask detection
- cpus_stack: NMI backtrace for all CPUs (multi-line text containing timestamps and call stacks)
- blocked_processes_stack: Kernel stack information of D-state processes
7. memory_reclaim_events
Description Detects direct memory reclaim events for container processes. Triggered when the direct reclaim time of the same process within 1 second exceeds the configured threshold (default 900ms). Records the reclaim duration, process, and container information. Note: this observer only records events for container processes; host process events are filtered out.
Data Storage Automatically stored in Elasticsearch or as files on the physical machine disk.
Sample Data
{
    "tracer_data": {
        "pid": 1896137,
        "tid": 1896138,
        "comm": "java",
        "reclaim_duration_ns": 1412702917
    }
}
Fields
- comm: Name of the process that triggered direct memory reclaim
- pid: PID of the triggering process
- tid: TID of the triggering thread
- reclaim_duration_ns: Direct reclaim duration (nanoseconds)
8. ras
Description Detects hardware errors from CPU, memory, and PCIe subsystems via kernel tracepoints. Supports five hardware error sources: MCE (Machine Check Exception), EDAC (memory controller), ACPI/GHES (non-standard hardware errors), PCIe AER (Advanced Error Reporting), and MCE threshold interrupts (THR). Errors are classified by severity: Corrected, UncorrectedRecoverable, UncorrectedDeferred, and UncorrectedFatal. MCE threshold interrupt events use a cooldown period (default 30 minutes) to suppress interrupt storm-driven duplicate reports.
Data Storage Automatically stored in Elasticsearch or as files on the physical machine disk.
MCE Sample Data
{
    "tracer_data": {
        "dev": "CPU/MEM",
        "event": "MCE",
        "type": "UncorrectedRecoverable",
        "info": "{\"mcg_cpu_cap\":4096,\"banks_msr_status\":9295429630892703744,\"cpu\":2,\"socketid\":0,\"bank\":5}"
    }
}
PCIe AER Sample Data
{
    "observed_timestamp": "2025-06-11T00:00:00Z",
    "tracer_data": {
        "dev": "PCIe 0000:3b:00.0",
        "event": "AER",
        "type": "UncorrectedRecoverable",
        "info": "{\"dev_name\":\"0000:3b:00.0\",\"err_type\":\"UncorrectedRecoverable\",\"err_reason\":\"Completion Timeout\",\"tlp_header\":\"not available\"}"
    }
}
Fields
- dev: Hardware device where the error occurred (e.g.,
CPU/MEM,PCIe 0000:3b:00.0) - event: Error type (
MCE/EDAC/NON_STANDARD/AER/MCE_THRESHOLD) - type: Error severity (
Corrected/UncorrectedRecoverable/UncorrectedDeferred/UncorrectedFatal/Info) - observed_timestamp: Top-level UTC userspace observation time;
kernel_observed_timestamprecords UTC kernel observation time - info: JSON-formatted detailed error information; content varies by event type
9. netdev_events
Description Detects NIC link state change events by subscribing to kernel netlink RTM_NEWLINK messages. Captures events including down/up transitions, MTU changes, AdminDown, and CarrierDown, along with interface name, link status, MAC address, and driver information. At startup, the observer scans the current state of all devices in device_list as a baseline; only state changes are reported thereafter.
Data Storage Automatically stored in Elasticsearch or as files on the physical machine disk.
Sample Data
{
    "tracer_data": {
        "ifname": "eth1",
        "index": 3,
        "linkstatus": "linkStatusAdminDown, linkStatusCarrierDown",
        "mac": "5c:6f:69:34:dc:72",
        "start": false,
        "driver": "ixgbe",
        "driver_version": "5.1.0-k",
        "firmware_version": "3.25 0x80000421 1.2163.0"
    }
}
Fields
- ifname: Network interface name (e.g.,
eth1) - index: Interface index number
- linkstatus: Link state change description (may contain multiple states)
- mac: NIC MAC address
- start: Whether this is a baseline event scanned at startup (
true: startup scan,false: real-time change event) - driver: NIC driver name
- driver_version: NIC driver version
- firmware_version: NIC firmware version
10. netdev_bonding_lacp
Description Detects LACP (Link Aggregation Control Protocol, IEEE 802.3ad) protocol state changes in bonding mode. Reads and records the complete status of all bonding interfaces under /proc/net/bonding/, including mode, MII status, Actor/Partner negotiation parameters, and slave link states. This observer is only activated automatically when an IEEE 802.3ad bonding interface is present on the system.
Data Storage Automatically stored in Elasticsearch or as files on the physical machine disk.
Sample Data
{
    "tracer_data": {
        "content": "/proc/net/bonding/bond0\nEthernet Channel Bonding Driver: v4.18.0...\nBonding Mode: IEEE 802.3ad Dynamic link aggregation\nMII Status: down\n..."
    }
}
Fields
- content: Complete bonding interface status information (multi-line text containing LACP negotiation details for all slaves, equivalent to the
/proc/net/bonding/bondXfile content)
11. netdev_txqueue_timeout
Description Detects NIC transmit queue timeout (TX queue timeout) events. Records the queue index, device name, and driver name where the timeout occurred, used to identify hardware failures on the NIC transmit path.
Data Storage Automatically stored in Elasticsearch or as files on the physical machine disk.
Sample Data
{
    "tracer_data": {
        "queue_index": 3,
        "device_name": "eth0",
        "driver_name": "ixgbe"
    }
}
Fields
- queue_index: Index of the transmit queue where the timeout occurred
- device_name: Network device name
- driver_name: NIC driver name
⚙️ How It Works
Architecture
HUATUO’s anomalous event observation is built on eBPF technology. Event data is collected in kernel space with minimal performance overhead, and processed by user-space daemons for formatting, filtering, container association, and persistent storage.
graph TB
    subgraph "Linux Kernel"
        direction TB
        K1["kprobe hooks\n(sched_tick / softlockup / hungtask\n memory_oom_kill / memory_reclaim_events\n net_rx_latency / netdev_txqueue_timeout\n tcp_retransmit TLP, optional)"]
        K2["tracepoint hooks\n(ras: MCE / EDAC / AER / ACPI\n dropwatch: skb/kfree_skb\n tcp_retransmit:\n tcp/tcp_retransmit_skb /\n tcp/tcp_retransmit_synack)"]
        K3["netlink subscription\n(netdev_events: RTM_NEWLINK)"]
        K4["kprobe hooks\n(netdev_bonding_lacp: 802.3ad)"]
        PEB["Perf Event Ring Buffer\n(8192 pages)"]
    end

    subgraph "HUATUO User Space"
        direction TB
        EH["Go event handler goroutines\n(one per event type)"]
        CF["Filters\n(threshold / noise reduction / known-issue filtering)"]
        CM["Container association\n(CSS → ContainerID\n NetNS → ContainerID)"]
    end

    subgraph "Storage"
        ES["Elasticsearch"]
        DISK["Local disk files"]
    end

    K1 --> PEB
    K2 --> PEB
    K4 --> PEB
    PEB --> EH
    K3 --> EH
    EH --> CF
    CF --> CM
    CM --> ES
    CM --> DISK
Event Processing Flow
sequenceDiagram
    participant K as Linux Kernel
    participant B as eBPF Program
    participant P as Perf Event Buffer
    participant H as Go Event Handler
    participant F as Filter
    participant S as Storage

    K->>B: kprobe / tracepoint fires
    B->>B: Collect event context<br/>(process info / kernel stack / network context)
    B->>P: Write to perf event ring buffer
    H->>P: Read event data (blocking)
    H->>F: Format and apply filters<br/>(threshold / noise / known issues)
    F->>H: Events that passed filtering
    H->>H: Associate container information<br/>(CSS / NetNS mapping)
    H->>S: Persist to storage<br/>(Elasticsearch / local files)

3 - AutoTracing
📖 Overview
AutoTracing is an event-driven automatic diagnosis mechanism. When a host or container shows performance anomalies — such as CPU spikes, accumulation of D-state processes, saturated disk IO, or sudden memory allocation — the system triggers on-site data collection automatically based on preset thresholds, with no manual intervention required.
Collected artifacts include eBPF flame graphs (system-wide or container-scoped CPU call stack samples via perf), D-state process kernel call stacks, disk IO call stacks, and process memory usage rankings. Each event type has a built-in cooldown period (30 minutes by default) to prevent redundant data from continuous triggers.
Five event types are supported: cpusys (host CPU sys spike), cpuidle (container CPU usage spike), dload (container D-state load spike), iotracing (disk IO anomaly), and memburst (memory burst allocation).
🎯 Use Cases
CPU Hotspot Analysis for AI Training Jobs: In GPU training clusters, intermittent training stalls are often caused by sudden increases in kernel-mode CPU usage (cpusys). When sys utilization exceeds the threshold, AutoTracing immediately triggers a system-wide perf flame graph collection, persisting kernel call stack hotspots as structured flame graph data (flamedata) for offline analysis after the anomaly has passed.
Container CPU Jitter Analysis in Kubernetes: In microservice architectures, brief container CPU spikes (cpuidle) may cause response timeouts, but the issue often recovers before alert responders can act. When container CPU exceeds the threshold, AutoTracing triggers container-scoped perf sampling and generates a flame graph scoped to the container’s cgroup, identifying hotspot functions and reducing time spent on log-based investigation.
D-State Process Accumulation in Cloud-Native Environments: Under high IO load or storage jitter, containers may accumulate large numbers of D-state (uninterruptible sleep) processes, causing system stalls. The dload event applies an exponential weighted moving average (EMA) to the container’s uninterruptible process load. When the EMA exceeds the threshold, kernel call stacks are collected for all D-state processes inside the container and on the host, pinpointing the blocking root cause.
Disk IO Bottleneck Root Cause Analysis: In data-intensive or log-heavy workloads, saturated disk IO utilization or write bandwidth causes application request backlog. iotracing continuously polls /proc/diskstats and triggers when any IO metric exceeds its threshold for two consecutive samples. It then collects a list of high-IO processes (with per-process read/write byte counts and open file details) and kernel call stacks of processes waiting in IO scheduling, narrowing down the processes responsible for high disk IO consumption.
🚀 Usage
Configuration
All events provide default values and work without configuration:
| Parameter | Default | Description |
|---|---|---|
cpuidle.user_threshold |
75 (%) |
Container CPU user utilization trigger threshold |
cpuidle.sys_threshold |
45 (%) |
Container CPU sys utilization trigger threshold |
cpuidle.usage_threshold |
90 (%) |
Container total CPU utilization trigger threshold |
cpuidle.delta_user_threshold |
45 (%) |
Container CPU user utilization delta trigger threshold |
cpuidle.delta_sys_threshold |
20 (%) |
Container CPU sys utilization delta trigger threshold |
cpuidle.delta_usage_threshold |
55 (%) |
Container total CPU utilization delta trigger threshold |
cpuidle.interval |
10 (s) |
Detection interval |
cpuidle.interval_tracing |
1800 (s) |
Per-container cooldown period between triggers |
cpuidle.run_tracing_tool_timeout |
10 (s) |
perf flame graph collection timeout |
cpusys.sys_threshold |
45 (%) |
Host CPU sys utilization trigger threshold |
cpusys.delta_sys_threshold |
20 (%) |
Host CPU sys utilization delta trigger threshold |
cpusys.interval |
10 (s) |
Detection interval |
cpusys.interval_tracing |
1800 (s) |
Global cooldown period between triggers |
cpusys.run_tracing_tool_timeout |
10 (s) |
perf flame graph collection timeout |
dload.threshold_load |
5 |
Container D-state process load EMA trigger threshold |
dload.interval |
10 (s) |
Detection interval |
dload.interval_tracing |
1800 (s) |
Per-container cooldown period between triggers |
iotracing.rbps_threshold |
2000 (MB/s) |
Disk read throughput trigger threshold |
iotracing.wbps_threshold |
1500 (MB/s) |
Disk write throughput trigger threshold |
iotracing.util_threshold |
90 (%) |
Disk IO utilization trigger threshold |
iotracing.await_threshold |
100 (ms) |
Disk IO average wait time trigger threshold |
iotracing.run_tracing_tool_timeout |
10 (s) |
IO call stack collection timeout |
iotracing.max_proc_dump |
10 |
Maximum number of high-IO processes to collect |
iotracing.max_files_per_proc_dump |
5 |
Maximum open files to collect per process |
memburst.delta_memory_burst |
100 (%) |
Anonymous memory growth rate threshold relative to the oldest sample in the sliding window (100% means ≥ 2× triggers) |
memburst.delta_anon_threshold |
70 (%) |
Anonymous memory as a percentage of total host memory threshold |
memburst.interval |
10 (s) |
Detection interval |
memburst.interval_tracing |
1800 (s) |
Cooldown period between triggers |
memburst.sliding_window_length |
60 |
Sliding window sample count (corresponding to 600 seconds of history) |
memburst.dump_process_max_num |
10 |
Maximum number of top memory-consuming processes to collect |
Event List
| Event Name (tracer_name) | Target | Trigger Condition | Typical Scenario |
|---|---|---|---|
cpusys |
Host | sys > 45% and delta_sys > 20% | Kernel-mode CPU spike, syscall hotspot |
cpuidle |
Container | (user>75% and delta_user>45%) or (sys>45% and delta_sys>20%) or (total>90% and delta_total>55%) | Container CPU spike, hotspot function analysis |
dload |
Container | D-state process load EMA > 5 | D-state process accumulation, IO blocking |
iotracing |
Host | Any IO metric exceeds threshold for two consecutive samples | Saturated disk IO, high IO wait latency |
memburst |
Host | Anonymous memory ≥ 2× oldest window sample and ≥ 70% of total memory | Memory burst allocation, OOM precursor |
Fields
All event records include the following common fields:
- hostname: Physical host hostname
- region: Availability zone of the physical host
- uploaded_timestamp: Data upload timestamp
- container_id: Container ID if the event is associated with a container
- container_hostname: Container hostname if the event is associated with a container
- container_host_namespace: Kubernetes namespace of the container
- container_type: Container type (e.g.,
normal,sidecar) - container_qos: Container QoS level
- tracer_name: Event name (e.g.,
cpusys,memburst) - tracer_id: Tracing session ID
- started_timestamp: Time when the tracing was triggered
- tracer_type: Observation kind; automatic tracing records use
autotracing - tracer_data: Event-specific private data (see individual event descriptions below)
1. cpusys
Description Periodically reads /proc/stat to calculate host CPU sys utilization and the delta between consecutive samples. When sys utilization exceeds the threshold (default 45%) and the delta exceeds its threshold (default 20%), a system-wide perf sampling run is triggered to generate a full-host CPU flame graph. A 30-minute global cooldown prevents repeated triggers.
Storage Event data is automatically stored in Elasticsearch or a local disk file.
Sample Data
{
    "tracer_name": "cpusys",
    "tracer_data": {
        "system_percent": 52,
        "system_percent_threshold": 45,
        "system_percent_delta": 25,
        "system_percent_delta_threshold": 20,
        "flamedata": [
            {"level": 0, "value": 1000, "self": 0, "label": "all"},
            {"level": 1, "value": 350, "self": 350, "label": "do_syscall_64"}
        ]
    }
}
Field Descriptions
- system_percent: Host CPU sys utilization at trigger time (%)
- system_percent_threshold: sys utilization trigger threshold (%)
- system_percent_delta: sys utilization delta between consecutive samples (%)
- system_percent_delta_threshold: sys delta trigger threshold (%)
- flamedata: Flame graph frame data from perf sampling. Each frame contains:
- level: Call stack depth level
- value: Sample count for this frame including descendant frames
- self: Sample count for this frame excluding descendant frames
- label: Function or process name label
2. cpuidle
Description Periodically reads container cgroup CPU statistics to calculate container CPU user, sys, and total utilization along with their inter-sample deltas. A trigger fires if any of the following conditions holds: (user>75% and delta_user>45%), or (sys>45% and delta_sys>20%), or (total>90% and delta_total>55%). Container-scoped perf sampling is then run to generate a flame graph. A 30-minute per-container cooldown prevents repeated triggers. Specific containers can be excluded via the filter configuration.
Storage Event data is automatically stored in Elasticsearch or a local disk file.
Sample Data
{
    "tracer_name": "cpuidle",
    "tracer_data": {
        "user_percent": 80,
        "user_percent_threshold": 75,
        "user_percent_delta": 48,
        "user_percent_delta_threshold": 45,
        "system_percent": 12,
        "system_percent_threshold": 45,
        "system_percent_delta": 5,
        "system_percent_delta_threshold": 20,
        "total_percent": 92,
        "total_percent_threshold": 90,
        "total_percent_delta": 53,
        "total_percent_delta_threshold": 55,
        "flamedata": [
            {"level": 0, "value": 1000, "self": 0, "label": "all"},
            {"level": 1, "value": 800, "self": 800, "label": "java/com.example.App.main"}
        ]
    }
}
Field Descriptions
- user_percent / user_percent_threshold: Container CPU user utilization at trigger time (%) and its threshold
- user_percent_delta / user_percent_delta_threshold: User utilization inter-sample delta (%) and its threshold
- system_percent / system_percent_threshold: Container CPU system utilization at trigger time (%) and its threshold
- system_percent_delta / system_percent_delta_threshold: System utilization inter-sample delta (%) and its threshold
- total_percent / total_percent_threshold: Container total CPU utilization at trigger time (%) and its threshold
- total_percent_delta / total_percent_delta_threshold: Total utilization inter-sample delta (%) and its threshold
- flamedata: Container-scoped perf flame graph frame data; field meanings same as
cpusys
3. dload
Description Reads container process states via netlink and cgroup, then computes an exponential weighted moving average (EMA) of the load contribution from uninterruptible (D-state) processes per container. When the EMA exceeds the threshold (default 5), kernel call stacks are collected for all D-state processes inside the container and on the host. Known-issue filtering (issues_list) reduces false positives. A 30-minute per-container cooldown applies.
Storage Event data is automatically stored in Elasticsearch or a local disk file.
Sample Data
{
    "tracer_name": "dload",
    "tracer_data": {
        "threshold": 5,
        "nr_sleeping": 120,
        "nr_running": 4,
        "nr_stopped": 0,
        "nr_uninterruptible": 8,
        "nr_iowait": 3,
        "load_avg": 7.23,
        "dload_avg": 6.81,
        "known_issue": "",
        "stack": "task:java            state:D stack:    0 pid: 12345 tgid: 12345 ...\n  io_schedule+0x18/0x40\n  ext4_file_write_iter+0x..."
    }
}
Field Descriptions
- threshold: D-state load EMA trigger threshold
- nr_sleeping: Number of sleeping processes in the container
- nr_running: Number of running processes in the container
- nr_stopped: Number of stopped processes in the container
- nr_uninterruptible: Number of uninterruptible (D-state) processes in the container
- nr_iowait: Number of IO-waiting processes in the container
- load_avg: Container load average at trigger time
- dload_avg: Container D-state load EMA value at trigger time
- known_issue: Matched known issue description (empty if none matched)
- stack: Kernel call stacks of D-state processes (multi-process, multi-line text)
4. iotracing
Description Polls /proc/diskstats at 5-second intervals to calculate per-disk read/write throughput, IO utilization, and IO wait time. md devices are excluded automatically. A trigger fires when any metric exceeds its threshold for two consecutive samples. On trigger, the system collects a list of high-IO processes (with per-process read/write byte counts and open file details) and kernel call stacks of processes waiting in IO scheduling.
Storage Event data is automatically stored in Elasticsearch or a local disk file.
Sample Data
{
    "tracer_name": "iotracing",
    "tracer_data": {
        "reason_snapshot": {
            "type": "ioutil",
            "device": "sda",
            "iostatus": {
                "read_bps": 120,
                "read_iops": 450,
                "read_await": 12,
                "write_bps": 2100,
                "write_iops": 890,
                "write_await": 145,
                "io_util": 95,
                "queue_size": 32
            }
        },
        "process_io_data": [
            {
                "pid": 12345,
                "comm": "java",
                "container_hostname": "app-pod-xxx",
                "fs_read": 0,
                "fs_write": 52428800,
                "disk_read": 0,
                "disk_write": 49152000,
                "file_stat": ["/data/logs/app.log"],
                "file_count": 1
            }
        ],
        "timeout_io_stack": [
            {
                "pid": 12345,
                "comm": "java",
                "container_hostname": "app-pod-xxx",
                "latency_us": 250000,
                "stack": {
                    "back_trace": [
                        "io_schedule+0x18/0x40",
                        "ext4_file_write_iter+0x2a0/0x4c0"
                    ]
                }
            }
        ]
    }
}
Field Descriptions
- reason_snapshot: Snapshot of the condition that triggered IO collection
- type: Trigger type (
ioutilIO utilization /read_bpsread throughput /write_bpswrite throughput /read_awaitread wait time /write_awaitwrite wait time) - device: Name of the disk device that exceeded the threshold
- iostatus: Disk IO metric snapshot at trigger time (
read_bps/write_bpsin MB/s,read_await/write_awaitin ms,io_utilin %,queue_sizeis queue depth)
- type: Trigger type (
- process_io_data: List of high-IO processes. Each record contains:
- pid / comm: Process PID and name
- container_hostname: Container hostname of the process (empty for host processes)
- fs_read / fs_write: Bytes read/written at the filesystem layer
- disk_read / disk_write: Bytes actually read/written at the disk layer
- file_stat: List of file paths currently open by the process
- file_count: Total number of files open by the process
- timeout_io_stack: Call stacks of processes waiting in IO scheduling. Each record contains:
- pid / comm: Process PID and name
- container_hostname: Container hostname of the process
- latency_us: IO wait duration (microseconds)
- stack.back_trace: List of kernel call stack frames
5. memburst
Description Periodically samples host anonymous memory usage and maintains a sliding window of 60 samples (corresponding to 600 seconds). A trigger fires when current anonymous memory is ≥ 2× the oldest sample in the window and anonymous memory accounts for ≥ 70% of total host memory. On trigger, the top N processes by memory consumption (default 10) are collected, recording their PID, process name, and RSS memory size. A 30-minute cooldown applies.
Storage Event data is automatically stored in Elasticsearch or a local disk file.
Sample Data
{
    "tracer_name": "memburst",
    "tracer_data": {
        "top_memory_usage": [
            {
                "pid": 3456,
                "process_name": "java",
                "memory_size": 8589934592
            },
            {
                "pid": 3789,
                "process_name": "python3",
                "memory_size": 2147483648
            }
        ]
    }
}
Field Descriptions
- top_memory_usage: List of top memory-consuming processes sorted by RSS in descending order. Each record contains:
- pid: Process PID
- process_name: Process name
- memory_size: Process RSS memory usage (bytes)
⚙️ Principle
Architecture
AutoTracing is built on periodic polling, combined with eBPF call stack collection and perf flame graph generation, to collect anomaly diagnostic data at the kernel level with low overhead.
graph TB
    subgraph "Data Sources"
        P1["/proc/stat\n(Host CPU utilization)"]
        P2["cgroup CPU stats\n(Container CPU utilization)"]
        P3["netlink / cgroup\n(Container process states / load average)"]
        P4["/proc/diskstats\n(Disk IO metrics)"]
        P5["/proc/meminfo\n+ cgroup memory stats"]
    end

    subgraph "HUATUO AutoTracing"
        DT["Threshold Detection\n(sliding window / EMA / two consecutive breaches)"]
        BO["Cooldown\n(30-minute backoff)"]
        PERF["perf Flame Graph\n(system-wide / container-scoped)"]
        BPF["eBPF kprobe\n(IO scheduling latency tracing)"]
        CM["Container Correlation\n(cgroup → ContainerID)"]
    end

    subgraph "Storage"
        ES["Elasticsearch"]
        DISK["Local Disk File"]
    end

    P1 --> DT
    P2 --> DT
    P3 --> DT
    P4 --> DT
    P5 --> DT
    DT --> BO
    BO --> PERF
    BO --> BPF
    PERF --> CM
    BPF --> CM
    CM --> ES
    CM --> DISK
Event Processing Flow
sequenceDiagram
    participant M as Periodic Metric Collection
    participant D as Threshold Detector
    participant B as Cooldown (backoff)
    participant C as On-site Data Collector
    participant S as Storage

    M->>D: Push metrics (every 10s)
    D->>D: Evaluate threshold (sliding window / EMA / consecutive)
    alt Threshold exceeded
        D->>B: Check cooldown state
        alt Trigger allowed
            B->>C: Trigger collection<br/>(perf flame graph / D-state stacks / IO process list)
            C->>C: Correlate container info (cgroup → ContainerID)
            C->>S: Persist data (Elasticsearch / local file)
        else In cooldown
            B-->>D: Skip this trigger
        end
    end
4 - Continuous Profiling
🚀 Quick Start
This guide uses build/docker/docker-compose.yml to start all services, create a host CPU profiling job, and view the flame graph in Grafana.
1. Start Services
First, configure Elasticsearch credentials so that huatuo-bamai and huatuo-apiserver can persist profile data. The config files are volume-mounted into the containers, so edit them directly in the project root.
In huatuo-bamai.conf:
[HTTPServer.Auth]
    BearerToken = "REPLACE_WITH_NODE_TOKEN"

[Storage]
    [Storage.Elasticsearch]
        Address = "http://127.0.0.1:9200"
        Index = "huatuo_bamai"
        Username = "elastic"
        Password = "huatuo-bamai"
In huatuo-apiserver.conf:
[Agent.Auth]
    BearerToken = "REPLACE_WITH_NODE_TOKEN"

[Elasticsearch]
    Address = "http://127.0.0.1:9200"
    Username = "elastic"
    Password = "huatuo-bamai"
    Index = "huatuo_bamai"

[Auth]
    [[Auth.Users]]
        ID = "administrator"
        BearerToken = "REPLACE_WITH_RANDOM_HEX"
        Admin = true
Then start all services from the project root:
docker compose --project-directory ./build/docker up
Run without
-dto observe startup logs. Add-dfor background mode.
| Service | Role | Default Port |
|---|---|---|
huatuo-bamai |
Agent, runs profiler sampling | 19704 |
huatuo-apiserver |
API entry point, creates and dispatches jobs | 12740 |
elasticsearch |
Stores profile data (index: huatuo_bamai) |
9200 |
grafana |
Flame graph visualization | 3000 |
2. Verify Services
In a new terminal, confirm all services are ready:
# Agent health check
$ curl -s http://localhost:19704/version | jq .data.name

"huatuo-bamai"

# API Server health check
$ curl -s http://localhost:12740/version | jq .data.name

"huatuo-apiserver"

# ES index status
$ curl -s -u elastic:huatuo-bamai "http://localhost:9200/_cat/indices/huatuo_bamai?v"

health status index        uuid                   pri rep docs.count docs.deleted store.size pri.store.size dataset.size
yellow open   huatuo_bamai 147fzHJhQ820GjCKFLh5ZQ   1   1         42            0    297.8kb        297.8kb      297.8kb
Set environment variables for subsequent API calls:
API_BASE="http://127.0.0.1:12740"
API_TOKEN="REPLACE_WITH_RANDOM_HEX"
3. Create a Host CPU Profiling Job
Use c language (native, covers C/C++/Go) to sample the entire host for 30 seconds:
# Use the actual hostname of the node
HOSTNAME=$(hostname)

JOB_ID=$(curl -s -X POST \
  -H "Authorization: Bearer ${API_TOKEN}" \
  -H "Content-Type: application/json" \
  -d "{
    \"type\": \"cpu\",
    \"language\": \"c\",
    \"mode\": \"oncpu\",
    \"scope\": \"host\",
    \"duration_seconds\": 30,
    \"hostname\": \"${HOSTNAME}\"
  }" \
  "${API_BASE}/v1/profiling" | jq -r .data.request_id)

echo "Job ID: $JOB_ID"
4. Verify Data in Elasticsearch
Each aggregation window is 10 seconds. A 30-second job produces approximately 3 profile documents. Wait for completion, then verify:
$ curl -s -u elastic:huatuo-bamai "http://localhost:9200/huatuo_bamai/_count" \
  -H "Content-Type: application/json" \
  -d '{"query":{"exists":{"field":"profile_data.profile"}}}' | jq .count

3
5. View the Flame Graph in Grafana
Open the Continuous Profiling (host) dashboard:
- URL: http://localhost:3000/d/continuous-profiling-host (replace
localhost:3000with your environment) - Credentials:
admin / admin(skip the default password change prompt)
Steps:
- Select a time range covering the profiling period
- Choose your
hostnameand settypetoprocess_cpu:cpu:nanoseconds:cpu:nanoseconds - The flame graph loads aggregated call stacks for the selected time range and updates dynamically
- Click a frame to zoom in; use the top table for symbol sorting, filtering, and statistics
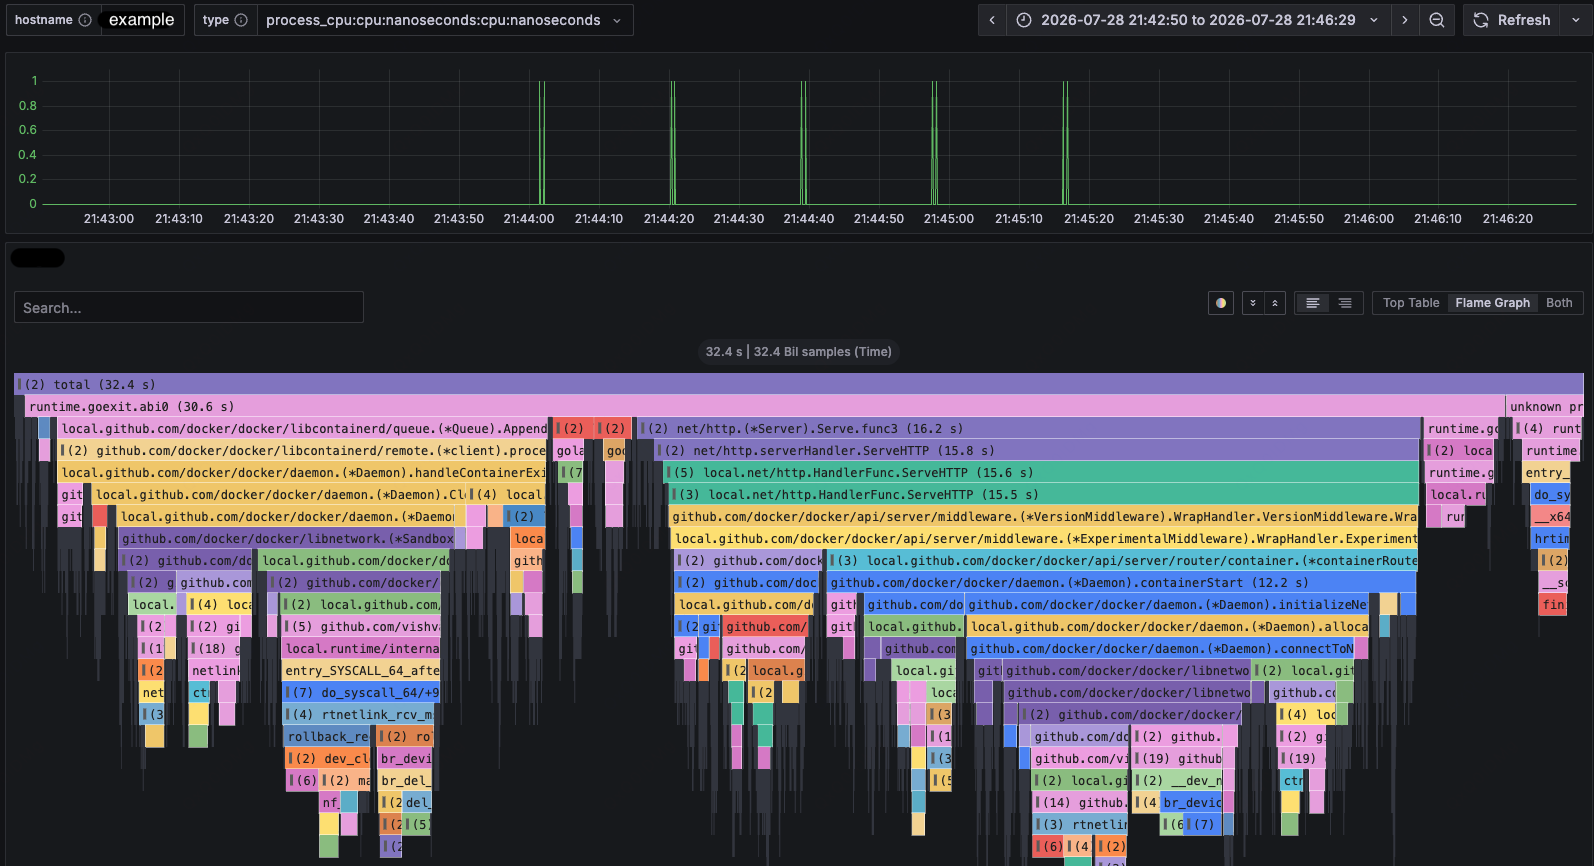
For more profiling dimensions, see the Profiling API section below.
🌐 Profiling API
huatuo-apiserver exposes /v1/profiling for creating, observing, and stopping
Profiling Jobs. Each create request is an independent execution. The Job is
durable in huatuo-apiserver while the Node owns only the in-memory Operation
and profiler process.
Elasticsearch is optional for Job control but required for raw results and Dashboard links. Node and Apiserver must use the same Elasticsearch index.
1. Request Conventions
By default, huatuo-apiserver listens on :12740. The following examples use environment variables for the server address and bearer token:
API_BASE="http://127.0.0.1:12740"
API_TOKEN="REPLACE_WITH_RANDOM_HEX"
Every request must pass the configured bearer token:
Authorization: Bearer REPLACE_WITH_RANDOM_HEX
A non-administrator user requires both /v1/profiling and
/v1/profiling/** permissions. Permissions may include an HTTP method, such as
GET /v1/profiling/**. Successful responses contain only data:
{
  "data": {}
}
Error responses contain a stable code and a human-readable message:
{
  "error": {
    "code": "result_unavailable",
    "message": "Job state does not provide a complete Profiling result"
  }
}
Clients must branch on error.code and must not parse error.message.
2. Query Profiling Capabilities
Before creating a job, query the profiling types, languages, CPU modes, memory modes, and runtime settings supported by the server:
curl -sS \
  -H "Authorization: Bearer ${API_TOKEN}" \
  "${API_BASE}/v1/profiling/capabilities"
data.items is a static versioned capability table. Each item contains:
| Field | Description |
|---|---|
type |
Profiling type: cpu or memory |
language |
Target language |
modes |
Valid mode values for this type/language pair |
supports_binary_match |
Whether binary_match_path is accepted |
supported_scopes |
Valid values for scope |
CPU profiling supports oncpu and offcpu for c, c++, and go;
java and python support only oncpu. Memory profiling supports these combinations:
| Language | mode |
Description |
|---|---|---|
c, c++, go |
virtual_alloc |
Virtual address-space allocation |
c, c++, go |
physical_alloc |
Physical page allocation |
c, c++, go |
physical_usage |
Current physical page residency |
java |
object_alloc |
JVM object allocation |
java |
object_usage |
JVM live objects |
3. Create a Profiling Job
POST /v1/profiling accepts the following JSON fields:
| Field | Required | Description |
|---|---|---|
type |
Yes | Profiling type: cpu or memory |
language |
Yes | Target process language; it must support the selected profiling type |
mode |
Yes | One mode advertised for the selected type/language pair |
duration_seconds |
Yes | Profiling duration in seconds |
hostname |
Yes | Hostname of the node running the target process; used for job scheduling |
scope |
Yes | host or container, as advertised by capabilities |
container_id |
For container scope | Target container ID |
binary_match_path |
No | Executable path matcher when the capability permits it |
Each request creates a new Job, even when its content matches an earlier request. Per-host and process-wide quotas reject excess active Jobs with HTTP 429.
Create a Go CPU profiling job on a host:
curl -sS -i \
  -X POST \
  -H "Authorization: Bearer ${API_TOKEN}" \
  -H "Content-Type: application/json" \
  -d '{
    "type": "cpu",
    "language": "go",
    "mode": "oncpu",
    "scope": "host",
    "duration_seconds": 60,
    "hostname": "node-01"
  }' \
  "${API_BASE}/v1/profiling"
Create a Java live-object profiling job in a container:
curl -sS -i \
  -X POST \
  -H "Authorization: Bearer ${API_TOKEN}" \
  -H "Content-Type: application/json" \
  -d '{
    "type": "memory",
    "language": "java",
    "mode": "object_usage",
    "scope": "container",
    "duration_seconds": 60,
    "container_id": "9f4c2f1a8b7d",
    "hostname": "node-01"
  }' \
  "${API_BASE}/v1/profiling"
A successful request returns 201 Created. The Location response header identifies the new job, and the response body contains the job ID used by subsequent requests:
{
  "data": {
    "request_id": "<profile-job-id>",
    "hostname": "node-01",
    "duration_seconds": 60,
    "scope": "host",
    "type": "cpu",
    "language": "go",
    "mode": "oncpu",
    "status": "pending",
    "created_at": "2026-08-24T10:00:00Z",
    "updated_at": "2026-08-24T10:00:00Z"
  }
}
JOB_ID="<profile-job-id>"
4. List Profiling Jobs
GET /v1/profiling supports these query parameters:
| Parameter | Default | Description |
|---|---|---|
limit |
100 |
Page size; must be between 1 and 1000 |
offset |
0 |
Starting offset; must be greater than or equal to 0 |
List the 20 most recent Profiling Jobs:
curl -sS -G \
  -H "Authorization: Bearer ${API_TOKEN}" \
  --data-urlencode "limit=20" \
  --data-urlencode "offset=0" \
  "${API_BASE}/v1/profiling"
The server always limits the result to Profiling Jobs and orders them by
created_at descending. data.items contains the job array. data.limit and
data.offset are the effective pagination parameters, and data.has_more
indicates whether another page is available. Non-administrator users can list
only jobs they created.
5. Get a Profiling Job
curl -sS \
  -H "Authorization: Bearer ${API_TOKEN}" \
  "${API_BASE}/v1/profiling/${JOB_ID}"
The data object contains the job details:
| Field | Description |
|---|---|
request_id |
Profiling Job ID used by all follow-up requests |
container_id |
Target container ID; omitted for host jobs |
hostname |
Target node hostname |
duration_seconds |
Requested profiling duration in seconds |
scope |
host or container |
type |
cpu or memory |
language |
Target process language |
mode |
Profiling mode selected from the capability table |
binary_match_path |
Executable path matcher; omitted when unused |
status |
Current job status |
terminal |
Terminal details {outcome, reason, message}; omitted while active |
created_at |
Job creation time |
updated_at |
Last Job state update time |
started_at |
Time execution started; omitted until observed running |
ended_at |
Terminal status time; omitted while the job is active |
result_url |
Dashboard URL returned by the detail endpoint when a complete result is available |
Profiling jobs use these statuses:
| Status | Description |
|---|---|
pending |
The job has been created and is waiting for the Agent |
running |
The Agent is collecting profiling data |
stopping |
A stop request has been persisted and is being applied asynchronously |
terminal |
The job has ended; inspect terminal.outcome for the result |
terminal.outcome is completed, failed, stopped, or unknown. For
failed, inspect terminal.reason and terminal.message. stopped means the
job was actively stopped and its result may be incomplete. unknown means the
Apiserver cannot verify the final Operation status, but a durably published
result may still be available.
operation_lost and execution_timed_out are terminal reason codes, not Job
statuses. Other failure codes include pending or stop deadline expiry, Node
unavailability, execution-capacity exhaustion, start or execution failure,
invalid_node_request for a Node request constructed incorrectly by the
Apiserver, and protocol errors.
6. Get Raw Profiling Data
GET /v1/profiling/:request_id/raw returns raw profiling windows only for a
Job whose terminal.outcome is completed or unknown and whose durable
publication marker exists. A missing or expired marker returns
result_not_found. Active Jobs return result_not_ready; failed and
stopped Jobs return
result_unavailable.
The response can be large, so it can be written directly to a file:
curl -sS \
  -H "Authorization: Bearer ${API_TOKEN}" \
  -o profile-raw.json \
  "${API_BASE}/v1/profiling/${JOB_ID}/raw?limit=100&offset=0"
The profiling windows are in data.items; data.limit, data.offset, and
data.has_more describe the page. Each item contains uploaded_timestamp,
started_timestamp, profile_type, and the pprof-compatible profile payload.
An empty, durably published result is a successful response with an empty
items array. limit defaults to 20 and accepts 1–100. Explicit limit=0
returns a parameter error; omitted limits use the default. If the encoded
profile data exceeds 64 MiB, the server returns 413 result_too_large; retry
with a smaller limit.
Flamegraph queries consume matching windows in batches of 100 and merge them incrementally, up to 100000 windows per request. A one-hour profile with one window per second therefore includes all 3600 windows. More than 100000 windows returns an error asking for a narrower range or filters. Query or merge errors never return a partial flamegraph. Raw Profile pages remain scoped to a Job; their page limit does not cap the full flamegraph query.
7. Stop a Profiling Job
Stop is an asynchronous intent. It is accepted for pending, running, or
already stopping Jobs:
curl -sS \
  -X POST \
  -H "Authorization: Bearer ${API_TOKEN}" \
  "${API_BASE}/v1/profiling/${JOB_ID}/stop"
A successful request returns 200 OK with the current Job snapshot. A terminal
Job returns 409 Conflict. Stopped Jobs do not expose results because their
final data may be incomplete.
📖 profiler CLI Overview
profiler is HUATUO’s standalone performance profiling CLI. It samples host processes or processes inside containers without requiring huatuo-apiserver, Elasticsearch, or Grafana. The tool supports C, C++, Go, Java, and Python processes and writes call stacks as folded stacks or SVG flame graphs.
C, C++, and Go use the eBPF-based native collector to observe on-CPU usage, off-CPU blocking and scheduling delay, virtual memory allocation, physical memory allocation, and physical memory residency. Java uses async-profiler to observe CPU usage, object allocation, and live objects. Python uses py-spy to observe CPU usage. The results can be used to locate hot functions, attribute memory growth, analyze processes inside containers, and preserve performance data for later diagnosis.
The remainder of this section covers standalone use of _output/bin/profiler. For service-based continuous profiling, see the Profiling API section above.
🎯 Use Cases
1. Locate CPU Hotspots and Call Paths
Sample the call stacks of C, C++, Go, Java, or Python processes at a fixed frequency and use stack width to identify the primary consumers of CPU time. The native collector can also limit sampling to selected CPUs with --cpuid, which is useful for analyzing CPU-pinned workloads or per-CPU hotspots.
2. Attribute Native Process Memory
Observe virtual address-space allocation, physical page allocation, and current physical page residency for C, C++, and Go processes. These modes distinguish between how much address space was requested, how much physical memory was allocated, and how much physical memory remains resident. They help locate call paths responsible for mmap activity, page-fault allocation, and resident memory growth.
3. Analyze JVM Object Allocation and Live Objects
Use async-profiler to collect Java object allocation or live-object call stacks. Object allocation profiles help locate high allocation rates and sources of GC pressure. Live-object profiles help identify objects that remain referenced during the collection window and the paths where they were allocated.
4. Analyze Containers and Multi-process Workloads
Use a container ID to resolve and profile target processes inside Docker or containerd workloads. Java and Python also accept comma-separated PID lists and can limit the number of concurrently running collector subprocesses, which is useful for service replicas and parent-child process groups.
🚀 Usage
1. Build and Runtime Requirements
Build all artifacts from the repository root:
make build
The resulting executable is _output/bin/profiler. Native profiling depends on Linux eBPF, perf events, and the BPF objects built from this repository. It generally requires root privileges and a kernel.perf_event_paranoid setting that permits sampling. Java profiling requires async-profiler; --tool-path points to the shared tool root containing bin/asprof and lib/libasyncProfiler.so. Python profiling requires py-spy under the same root.
Display the complete help for the current version:
_output/bin/profiler --help
The basic command structure is:
sudo _output/bin/profiler \
  --type <cpu|memory> \
  --language <c|c++|go|java|python> \
  --pid <pid> \
  --duration 30 \
  --aggr-interval 10 \
  --output-format flamegraph \
  --output-path ./profiles
--type and --language are required. Java, Python, and native memory profiling require exactly one target specified with either --pid or --container-id. Native CPU profiling can sample the entire host when neither target is specified.
2. General CLI Options
| Option | Default | Scope | Description |
|---|---|---|---|
--type, -t |
None | All | Profile type: cpu or memory; required |
--language, -l |
None | All | Target language: c, c++, go, java, or python; required |
--pid, -p |
None | All | Target PID; Java and Python accept comma-separated PIDs, while native profiling accepts at most one PID |
--container-id |
None | All | Target container ID; mutually exclusive with --pid |
--duration, -d |
10 |
All | Total profiling duration in seconds; minimum 1 |
--aggr-interval |
10 |
All | Aggregation interval in seconds; must not exceed the duration |
--freq, -F |
99 |
CPU | Samples collected per second; maximum 1000 for Java |
--output-path |
. |
Local output | Output directory, not an output file name |
--output-format |
collapsed |
All | collapsed, flamegraph, svg, or remote |
--output-storage |
/var/run/huatuo-toolstream.sock |
remote |
Unix socket used for remote upload |
--max-concurrent-procs |
0 |
Java, Python | Maximum concurrent collector subprocesses; 0 means unlimited |
--tool-path |
None | Java, Python | Shared external tool root; required |
--binary-match-path |
None | Java, Python | Executable path used to match target processes |
--huatuo-api-address |
127.0.0.1:19704 |
Container targets | HUATUO API address used to resolve container metadata |
--tracer-id |
Empty; generated internally for local output | All; required for remote |
Stable profiling task ID used by toolstream and remote storage |
--enable-pprof |
false |
Profiler itself | Expose Go pprof endpoints for the profiler process on :6000 |
--version-format |
text |
Version query | Output format for --version: text, json, or short |
--help, -h |
- | All | Display command help |
--version, -v |
- | All | Display version and build information |
Native profiling options:
| Option | Default | Scope | Description |
|---|---|---|---|
--memory-mode |
None | Native memory, Java memory | Memory profiling mode; required with --type memory |
--cpuid |
All CPUs | Native CPU | Comma-separated CPU list or ranges; off-CPU samples use the task’s switch-out CPU |
--cpu-mode |
oncpu |
Native CPU | oncpu for frequency sampling or offcpu for blocked/runqueue time attribution |
--require-hardware-pmu |
false |
Native on-CPU | Require hardware PMU sampling; fail instead of falling back to the software CPU clock |
--offcpu-phase |
all |
Native off-CPU | Accumulate all, blocked, or runqueue time |
--offcpu-min-duration-us |
1000 |
Native off-CPU | Discard phases shorter than this duration in microseconds |
--offcpu-stats |
false |
Native off-CPU | Collect BPF diagnostic statistics; adds overhead to error and cleanup paths |
--thread-group |
false |
Native | Also profile other threads in the target PID’s thread group |
--physical-memory-probability |
100 |
Native physical memory | Physical memory event sampling probability from 1 to 100 |
--log-bpf-debug |
false |
Native | Emit BPF debug events; not recommended for normal profiling |
Logging options:
| Option | Default | Description |
|---|---|---|
--log-level |
error |
trace, debug, info, warn, or error |
--log-file |
stdout |
Log file path, or stdout |
--log-size |
100 |
Log rotation size in MB; 0 disables rotation; applies only to file output |
--verbose |
false |
Equivalent to --log-level debug --log-file stdout and overrides both explicit logging options |
3. Observing C, C++, and Go
C, C++, and Go use the same native eBPF collector; only the --language value changes. CPU mode counts call-stack samples and includes user-space and kernel-space stacks when symbols can be resolved.
sudo _output/bin/profiler \
  --type cpu \
  --language go \
  --pid 12345 \
  --duration 30 \
  --aggr-interval 10 \
  --freq 99 \
  --output-format flamegraph \
  --output-path ./profiles/go-cpu
Add --thread-group to include worker threads in the same process. Add --cpuid 2,4-7 to limit collection to selected CPUs. Native CPU profiling also supports container-level and host-level collection:
Native on-CPU profiling first uses hardware CPU-cycle events and falls back to
the software CPU clock when the hardware PMU is unavailable. --freq remains
samples per second for either source. Use --require-hardware-pmu when software
clock fallback would hide IRQ-disabled CPU time.
# Profile a specific container
sudo _output/bin/profiler \
  --type cpu --language c --container-id <container-id> \
  --duration 30 --aggr-interval 10 \
  --output-format collapsed --output-path ./profiles/container

# Profile the host without specifying a PID or container
sudo _output/bin/profiler \
  --type cpu --language c \
  --duration 30 --aggr-interval 10 \
  --output-format flamegraph --output-path ./profiles/host
To attribute time spent outside the CPU to the call path that descheduled, select off-CPU mode:
sudo _output/bin/profiler \
  --type cpu --language go --pid 12345 --thread-group \
  --cpu-mode offcpu --offcpu-phase all \
  --cpuid 2,4-7 \
  --offcpu-min-duration-us 1000 \
  --duration 30 --aggr-interval 10 \
  --output-format flamegraph --output-path ./profiles/go-offcpu
Off-CPU output is event-driven, so --freq does not apply. With --cpuid, an interval is collected only when the task switches out from a selected CPU; later wakeup or switch-in on another CPU does not change that attribution. Flame graphs use nanoseconds directly and add roots such as off-CPU blocked, scheduling delay (preempted), and scheduling delay (yielded). The all phase includes blocked and runqueue time but keeps them separated by these roots. A single stable BPF stack map is used so a long sleep cannot be resolved against a later rotating stack-map generation.
Native memory profiling supports these dimensions:
--memory-mode |
Measurement | Suitable for |
|---|---|---|
virtual_alloc |
Virtual address-space allocation and its call stacks | Excessive mmap activity and address-space growth |
physical_alloc |
Physical memory newly allocated during the collection window | Physical page allocation triggered by page faults and allocation-rate analysis |
physical_usage |
Physical memory still resident at collection time | Sources of resident memory and paths retaining physical pages |
sudo _output/bin/profiler \
  --type memory \
  --language c++ \
  --memory-mode physical_usage \
  --pid 12345 \
  --thread-group \
  --physical-memory-probability 100 \
  --duration 30 \
  --aggr-interval 10 \
  --output-format flamegraph \
  --output-path ./profiles/native-memory
--physical-memory-probability applies only to physical_alloc and physical_usage. Lowering it reduces processing for high-frequency memory events, but flame-graph values are then estimates based on sampled events rather than counts of every event.
4. Observing Java
Java CPU profiling depends on async-profiler. It supports a single PID, a container, or multiple PIDs:
_output/bin/profiler \
  --type cpu \
  --language java \
  --pid 12345,12346 \
  --tool-path /opt/huatuo/tools \
  --max-concurrent-procs 2 \
  --duration 30 \
  --aggr-interval 10 \
  --freq 99 \
  --output-format flamegraph \
  --output-path ./profiles/java-cpu
Java memory profiling supports two dimensions:
--memory-mode |
Measurement | Suitable for |
|---|---|---|
object_alloc |
Objects allocated during the collection window and their allocation call stacks | High allocation rates, short-lived objects, and sources of GC pressure |
object_usage |
Live objects and their allocation call stacks | Long-lived objects, sources of heap usage, and suspected memory leaks |
_output/bin/profiler \
  --type memory \
  --language java \
  --memory-mode object_usage \
  --pid 12345 \
  --tool-path /opt/huatuo/tools \
  --duration 30 \
  --aggr-interval 10 \
  --output-format flamegraph \
  --output-path ./profiles/java-memory
To target a container, replace --pid with --container-id <container-id>. If a container has multiple candidate processes, use --binary-match-path to select the target executable path.
5. Observing Python
Python currently supports CPU profiling only. --aggr-interval must equal --duration, so one collection produces one aggregation window. --tool-path points to the shared tool root containing py-spy.
_output/bin/profiler \
  --type cpu \
  --language python \
  --pid 12345,12346 \
  --tool-path /opt/huatuo/tools \
  --max-concurrent-procs 2 \
  --duration 30 \
  --aggr-interval 30 \
  --freq 99 \
  --output-format flamegraph \
  --output-path ./profiles/python-cpu
Python does not support --type memory. Use a separate memory analysis tool for Python memory profiling; the current profiler command does not invoke memray to generate Python memory profiles.
6. Choosing a Flame Graph and Output Format
| Format | Output | When to use it |
|---|---|---|
collapsed |
perf_<Unix timestamp>.folded; each line contains a semicolon-separated call stack followed by a count |
Scripted searches, result comparison, or rendering later with another flame-graph tool |
flamegraph |
flamegraph_<Unix timestamp>.svg; an SVG with embedded interaction scripts |
Default format for manual analysis; supports searching, zooming, and inspecting frame values in a browser |
svg |
The same interactive SVG as flamegraph |
Compatibility with callers that explicitly request SVG; currently equivalent to flamegraph |
remote |
No local flame graph; uploads pprof-compatible data through a Unix socket | Integration with the HUATUO storage pipeline; not suitable for offline viewing |
A flame graph shows the call direction from bottom to top. Rectangle width represents the cumulative value for that call stack in the selected profiling mode. For CPU profiles, width represents the proportion of CPU time derived from sample counts. For memory profiles, it represents virtual allocation, physical allocation, physical residency, Java object allocation, or live-object volume, depending on the selected mode. Horizontal position does not represent chronological order.
Example folded stacks:
main;handleRequest;parsePayload 428
main;handleRequest;writeResponse 172
Choose collapsed when you need to retain raw data and later render it with different colors or filters. Choose flamegraph when you want to inspect hotspots directly. remote depends on the HUATUO toolstream Unix socket, requires a non-empty --tracer-id, and should not be selected for standalone offline use.
7. Reproducing Integration Test Examples
The repository’s integration tests provide executable end-to-end examples. Each test creates a target process, runs profiler, and verifies the expected call stack in the output:
# Native CPU
sudo ./integration/run.sh test_profiler_native_cpu.sh

# Native off-CPU blocking and scheduling delay
sudo ./integration/run.sh test_profiler_native_cpu_offcpu.sh

# Native virtual and physical memory
sudo ./integration/run.sh test_profiler_native_memory_virtual_alloc.sh
sudo ./integration/run.sh test_profiler_native_memory_physical_usage.sh

# Java CPU and memory
sudo ./integration/run.sh test_profiler_java_cpu_multi_pid.sh
sudo ./integration/run.sh test_profiler_java_memory_usage_alloc.sh

# Python multi-process CPU
sudo ./integration/run.sh test_profiler_python_cpu_multi_pid.sh
Container, thread-group, and CPU-selection examples are available in test_profiler_native_cpu_container.sh, test_profiler_native_cpu_thread_group.sh, and test_profiler_native_cpu_cpuid.sh, respectively. Run make build first and configure the Java or Python profiler path in integration/env.sh as needed.
⚙️ How It Works
profiler first selects a collector based on the language and profile type. The native on-CPU collector attaches eBPF programs to perf events; off-CPU mode attaches scheduler switch, wakeup, exit, and task-free tracepoints. Native memory collectors record allocation and release paths through kernel events. The Java and Python collectors start async-profiler and py-spy subprocesses, respectively. Collected records enter a common aggregation pipeline, which merges counts by call stack and then writes a local file or uploads the result to remote storage.
flowchart LR
    CLI[profiler CLI options] --> Select{Language and profile type}
    Select -->|C/C++/Go| Native[Native eBPF collector]
    Select -->|Java| Java[async-profiler]
    Select -->|Python| Python[py-spy]
    Native --> Queue[Sample record queue]
    Java --> Queue
    Python --> Queue
    Queue --> Aggregate[Aggregate by call stack]
    Aggregate --> Folded[Collapsed stacks]
    Aggregate --> SVG[Interactive SVG flame graph]
    Aggregate --> Remote[Remote upload through Unix socket]
--duration controls the collection lifetime, while --aggr-interval controls the snapshot interval for remote uploads. Local collapsed, flamegraph, and svg modes write the final aggregate when collection ends. remote creates and uploads snapshots at the aggregation interval. The queue decouples collection from symbolization, aggregation, and output so file rendering does not block the sampling path.
🌟 Conclusion
5 - Hardware Events
Overview
HUATUO monitors Linux kernel hardware error events with zero instrumentation overhead and minimal runtime cost. Structured fault records are persisted to storage and exposed as Prometheus counters for use by alerting and visualization systems.
Use Cases
-
General-Purpose Computing
In large-scale server clusters, memory ECC correctable errors (CE) are common low-severity fault signals. A single CE is automatically corrected by hardware. If the CE rate on a given DIMM rises persistently, however, it indicates impending memory failure. HUATUO detects such events in real time via EDAC/MCE tracepoints, enabling operations teams to perform preventive replacements before complete memory failure and unplanned downtime occur.
-
AI Computing
AI training workloads require high hardware reliability. A single faulty PCIe device can cause an entire training job to fail. HUATUO supports PCIe AER event monitoring and reports link-layer errors on GPUs, NVLink bridges, and RDMA NICs (such as InfiniBand HCAs) — including Data Link Protocol Errors and ECRC Errors — in real time. This data provides hardware health status to AI cluster schedulers, supporting rapid fault node isolation and workload migration.
-
Storage Services
Storage servers typically host large numbers of PCIe NVMe SSDs and HBA cards. PCIe AER errors such as Completion Timeout and Malformed TLP are early indicators of storage device performance degradation or drive dropout. HUATUO monitoring data can be correlated with storage I/O latency metrics to support root cause analysis.
-
Security and Compliance
Industries with strict compliance requirements — such as finance and government — must maintain a complete history of all hardware faults. Structured event records (including timestamps, device identifiers, error types, and raw register values) can serve directly as compliance evidence for hardware health logs.
How It Works
HUATUO observes the kernel’s MCE, EDAC, ACPI GHES, and PCIe AER subsystems via eBPF. When an eBPF tracepoint fires, the raw event is written to a BPF Perf Event Buffer. A user-space process reads the event, parses the struct fields, generates a structured record, and persists it locally or to a remote store. The overall architecture is shown below:
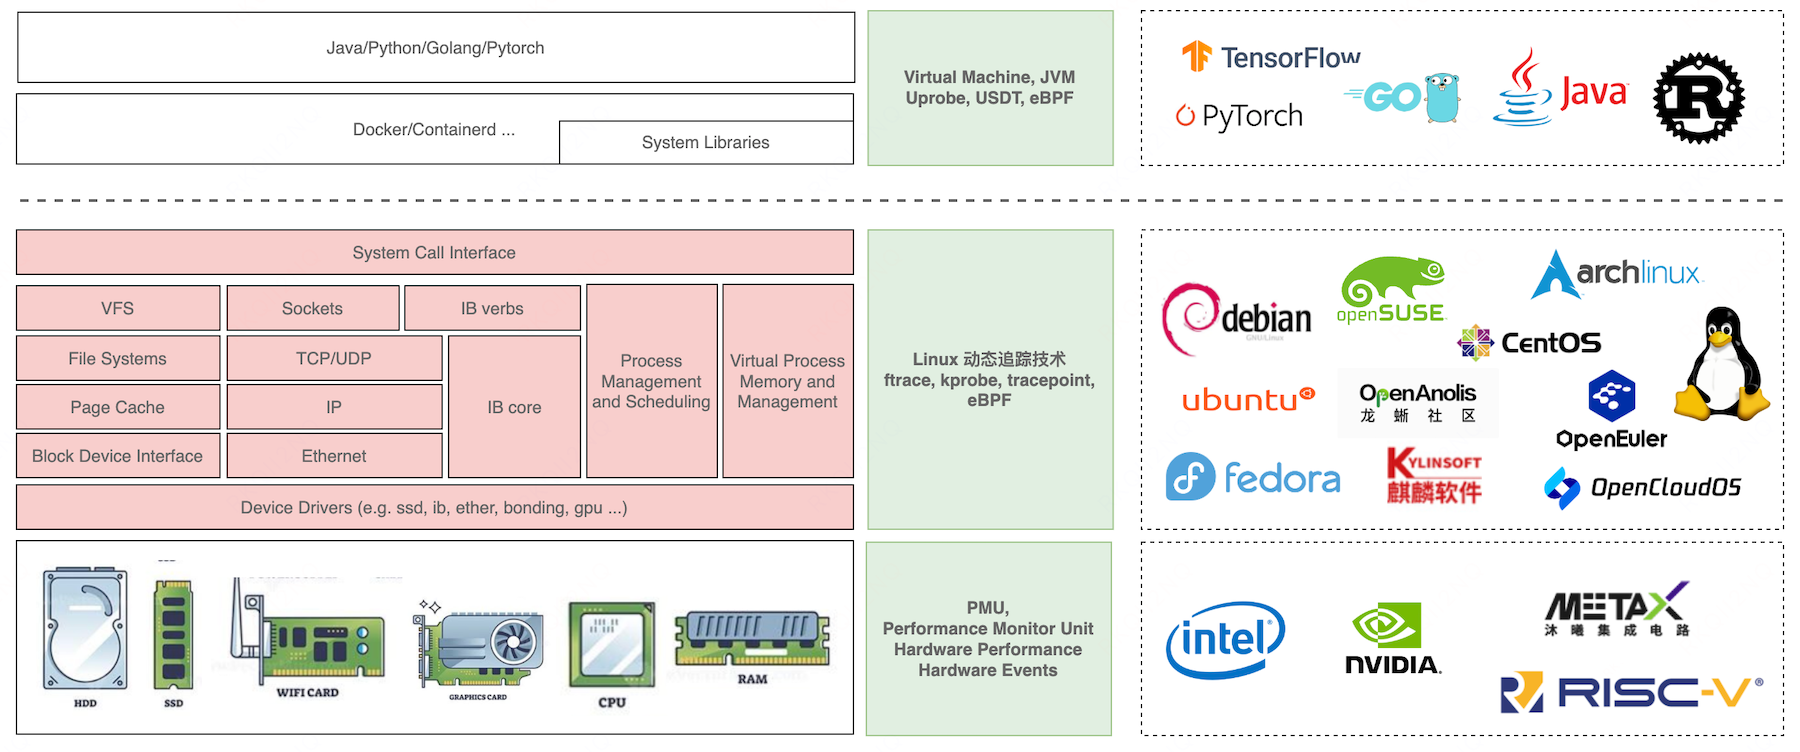
RAS Architecture
The Linux kernel’s RAS framework consists of several loosely coupled subsystems. Together, they cover the full hardware fault spectrum — from CPU internal errors to PCIe link errors.
graph TB
    subgraph HW["Hardware Layer"]
        CPU["CPU\nx86 / x86-64"]
        MEM["Memory\nDDR4/DDR5 DIMM ECC"]
        Platform["Platform Hardware\nSoC / PCH"]
        PCIeDev["PCIe Devices\nGPU / NVMe / HCA / FPGA"]
    end

    subgraph FW["Firmware Layer"]
        BIOS["BIOS / UEFI\nCPER Buffer (APEI)"]
    end

    subgraph Kernel["Linux Kernel RAS Subsystems"]
        MCE["MCE Subsystem\narch/x86/kernel/cpu/mce"]
        EDAC["EDAC Subsystem\ndrivers/edac"]
        GHES["ACPI GHES Subsystem\ndrivers/acpi/apei"]
        AER["PCIe AER Subsystem\ndrivers/pci/pcie/aer"]
    end

    subgraph TP["Kernel Tracepoints"]
        TP1["tracepoint/mce/mce_record"]
        TP2["tracepoint/ras/mc_event"]
        TP3["tracepoint/ras/non_standard_event"]
        TP4["tracepoint/ras/aer_event"]
    end

    CPU -->|"MCE Exception (#MC) + THR Interrupt"| MCE
    MEM -->|ECC Error| EDAC
    Platform -->|APEI Error Record| BIOS
    BIOS -->|CPER Buffer| GHES
    PCIeDev -->|AER Interrupt| AER

    MCE --> TP1
    EDAC --> TP2
    GHES --> TP3
    AER --> TP4
-
MCE
MCE (Machine Check Architecture) is a hardware fault-tolerance mechanism built into the processor, defined by Intel and AMD in their respective architecture specifications. The processor contains a set of Machine Check Banks, each corresponding to a class of hardware resource (e.g., L1 cache, L2 cache, memory controller, TLB). When a hardware error is detected, the MSRs of the corresponding bank (
MCi_STATUS,MCi_ADDR,MCi_MISC) are populated with error information, and an MCE exception is raised. -
MCE THR
MCE supports a threshold interrupt mechanism. When the count of a given class of correctable errors exceeds a configured threshold, a dedicated APIC interrupt (THR) is triggered instead of escalating to a full MCE exception. This allows the operating system to issue an early alert when the error rate rises abnormally, rather than waiting until the error becomes uncorrectable.
-
EDAC
EDAC (Error Detection And Correction) is the Linux kernel subsystem dedicated to handling memory and hardware ECC errors. Its stated goal is “to detect and report errors occurring in the computer hardware running under Linux.” EDAC drivers communicate directly with the memory controller and parse the physical location of ECC errors — including memory controller index, channel, slot, and row/column address.
-
ACPI GHES
ACPI GHES (Generic Hardware Error Source) is a platform-agnostic hardware error reporting mechanism defined by the BIOS/UEFI through the APEI (ACPI Platform Error Interface) specification. The BIOS firmware writes hardware errors that cannot be handled by a specific driver — such as SoC-internal errors or platform-specific memory errors — into CPER (Common Platform Error Record) buffers described in the GHES descriptor. The Linux kernel reads these CPER records and reports the “non-standard” error sections that cannot be parsed by a standard subsystem.
-
PCIe AER
PCIe AER (Advanced Error Reporting) is an error reporting mechanism defined in the PCIe specification. It enables PCIe devices to report link-layer and transaction-layer errors to the operating system with precision.
Metrics Reference
-
RAS Metrics
# HELP huatuo_bamai_ras_hw_total total RAS hardware error events by source type # TYPE huatuo_bamai_ras_hw_total counter huatuo_bamai_ras_hw_total{host="hostname",region="dev",type="acpi"} 0 huatuo_bamai_ras_hw_total{host="hostname",region="dev",type="aer"} 0 huatuo_bamai_ras_hw_total{host="hostname",region="dev",type="edac"} 0 huatuo_bamai_ras_hw_total{host="hostname",region="dev",type="mce"} 0 huatuo_bamai_ras_hw_total{host="hostname",region="dev",type="thr"} 0 -
NIC Packet Drop
huatuo_bamai_netdev_hw_rx_dropped_total{host="hostname",region="dev",device="eth0",driver="ixgbe"} 0 -
RDMA PFC
# HELP huatuo_bamai_netdev_dcb_pfc_received_total count of the received pfc frames # TYPE huatuo_bamai_netdev_dcb_pfc_received_total counter huatuo_bamai_netdev_dcb_pfc_received_total{device="enp6s0f0np0",host="hostname",prio="0",region="dev"} 0 huatuo_bamai_netdev_dcb_pfc_received_total{device="enp6s0f0np0",host="hostname",prio="1",region="dev"} 0 huatuo_bamai_netdev_dcb_pfc_received_total{device="enp6s0f0np0",host="hostname",prio="2",region="dev"} 0 huatuo_bamai_netdev_dcb_pfc_received_total{device="enp6s0f0np0",host="hostname",prio="3",region="dev"} 0 huatuo_bamai_netdev_dcb_pfc_received_total{device="enp6s0f0np0",host="hostname",prio="4",region="dev"} 0 huatuo_bamai_netdev_dcb_pfc_received_total{device="enp6s0f0np0",host="hostname",prio="5",region="dev"} 0 huatuo_bamai_netdev_dcb_pfc_received_total{device="enp6s0f0np0",host="hostname",prio="6",region="dev"} 0 huatuo_bamai_netdev_dcb_pfc_received_total{device="enp6s0f0np0",host="hostname",prio="7",region="dev"} 0 # HELP huatuo_bamai_netdev_dcb_pfc_send_total count of the sent pfc frames # TYPE huatuo_bamai_netdev_dcb_pfc_send_total counter huatuo_bamai_netdev_dcb_pfc_send_total{device="enp6s0f0np0",host="hostname",prio="0",region="dev"} 0 huatuo_bamai_netdev_dcb_pfc_send_total{device="enp6s0f0np0",host="hostname",prio="1",region="dev"} 0 huatuo_bamai_netdev_dcb_pfc_send_total{device="enp6s0f0np0",host="hostname",prio="2",region="dev"} 0 huatuo_bamai_netdev_dcb_pfc_send_total{device="enp6s0f0np0",host="hostname",prio="3",region="dev"} 0 huatuo_bamai_netdev_dcb_pfc_send_total{device="enp6s0f0np0",host="hostname",prio="4",region="dev"} 0 huatuo_bamai_netdev_dcb_pfc_send_total{device="enp6s0f0np0",host="hostname",prio="5",region="dev"} 0 huatuo_bamai_netdev_dcb_pfc_send_total{device="enp6s0f0np0",host="hostname",prio="6",region="dev"} 0 huatuo_bamai_netdev_dcb_pfc_send_total{device="enp6s0f0np0",host="hostname",prio="7",region="dev"} 0 -
Storage
Every hardware error event is persisted in structured form — either to the local
huatuo-localdirectory or to a remote store such as Elasticsearch or OpenSearch. All records share the following common fields:{ "hostname": "hostname", "region": "dev", "uploaded_timestamp": "2026-03-05T18:28:39.153438921+08:00", "tracer_name": "netdev_event", "observed_timestamp": "2026-03-05T18:28:39.153+08:00", "tracer_type": "event", "tracer_data": { "ifname": "eth0", "index": 2, "linkstatus": "linkstatus_admindown", "mac": "5c:6f:11:11:11:11", "start": false } }The
linkstatusfield takes the following values:linkstatus_adminup— brought up by an administrator, e.g.,ip link set dev eth0 uplinkstatus_admindown— brought down by an administrator, e.g.,ip link set dev eth0 downlinkstatus_carrierup— physical link restoredlinkstatus_carrierdown— physical link failure
{
    "hostname": "localhost",
    "region": "xxx",
    "uploaded_timestamp": "2026-05-11T16:58:47.328548319+08:00",
    "tracer_name": "ras",
    "observed_timestamp": "2026-05-11T08:58:47.329Z",
    "kernel_observed_timestamp": "2026-05-11T08:58:47.328548319Z",
    "tracer_type": "event",
    "tracer_data": {
        "dev": "MEM",
        "event": "EDAC",
        "type": "Corrected",
        "info": "{\"err_count\":0,\"err_type\":\"Corrected\",\"err_msg\":\"memory read error\",\"label\":\"CPU_SrcID#0_Ha#0_Chan#0_DIMM#0\",\"mc_index\":0,\"top_layer\":0,\"mid_layer\":0,\"low_layer\":-1,\"addr\":7860269056,\"grain\":128,\"syndrome\":0,\"driver\":\" area:DRAM err_code:0000:009f socket:0 ha:0 channel_mask:1 rank:0\"}"
    }
}
Field Description DeviceIdentifier of the hardware component where the error occurred (e.g., CPU/MEM,MEM,ACPI,PCIe 0000:01:00.0)EventEvent subtype ( MCE,EDAC,APIC,AER)ErrTypeError severity level (see table below) ObservedTimestampUTC userspace observation time KernelObservedTimestampUTC kernel observation time (top-level Document field) InfoDetailed fields for the specific event Error Type Description Typical Sources CorrectedAutomatically corrected by hardware; transparent to the OS MCE CE, EDAC CE, ACPI Sev=1, AER Severity=2 UncorrectedRecoverableNot corrected by hardware, but recoverable by system software MCE UE, EDAC UE, ACPI Sev=2, AER Severity=0 UncorrectedDeferredNot corrected by hardware; requires deferred handling MCE MCI_STATUS_DEFERRED, EDAC HW_EVENT_ERR_DEFERRED UncorrectedFatalFatal hardware error; requires immediate reboot EDAC FATAL, ACPI Sev=3, AER Severity=0 InfoError type for which the system is expected to log informational records EDAC HW_EVENT_ERR_INFO, ACPI Sev=0
Field Reference
-
MCE
Monitored components: CPU cores, L1/L2/L3 cache, TLB, memory controller (IMC), and interconnect buses (QPI/UPI/Infinity Fabric).
Field MSR Source Description mcg_cpu_capMCG_CAPMachine Check Global Capability Register. The lower 8 bits ( Count) indicate the number of MC Banks in the system.mcg_msr_statusMCG_STATUSMachine Check Global Status Register. banks_msr_statusMCi_STATUSBank Status Register (primary field). The lower 16 bits contain the MCA error code, classifying the error type (e.g., memory hierarchy error, bus error). The upper bits include control flags: UC(uncorrectable),EN(enabled),MISCV(MISC valid),ADDRV(ADDR valid), andPCC(processor context corrupt).banks_msr_addrMCi_ADDRPhysical memory address where the error occurred (valid only when MCi_STATUS.ADDRV=1). Used to identify the faulty DIMM or cache line.banks_msr_miscMCi_MISCSupplementary information register (valid only when MCi_STATUS.MISCV=1).mca_synd_msrMCA_SYNDSyndrome register (AMD-specific). mca_ipid_msrMCA_IPIDInstance ID register (AMD-specific). instr_pointerRIP register Instruction pointer at the time of the MCE (reliable only when MCG_STATUS.EIPV=1).tsc_timestampTSC CPU timestamp counter value at the time of the error (can be converted to absolute time using the kernel clock). walltimeKernel time Unix timestamp (in seconds) at the time of the error. cpu— Logical CPU number where the MCE occurred. cpuidCPUID CPUID value of the CPU where the MCE occurred (includes Family, Model, and Stepping). apicidAPIC ID APIC ID of the CPU where the MCE occurred (can be mapped to a physical core or hyperthread). socketid— CPU socket number (Socket ID). Used to identify physical CPUs in multi-socket servers. code_segCS register Code segment register value at the time of the MCE (used to determine privilege level). bank— Bank number (typically: Bank 0 = L1I, Bank 1 = L1D, Bank 2 = L2, Bank 4+ = memory controller; numbering varies by platform). cpuvendor— CPU vendor identifier: 0= Intel,1= Unknown,2= AMD. -
EDAC
Monitored components: memory ECC errors.
Field Description err_countCumulative error count for this event. err_typeError severity level. err_msgHuman-readable error description string (e.g., "CE memory read error on CPU#0Channel#0_DIMM#0 (channel:0 slot:0 page:0x12345 offset:0x0 grain:8 syndrome:0x0)").labelPhysical DIMM location label (e.g., "CPU_SrcID#0_Ha#0_Chan#0_DIMM#0"). Generated by the EDAC driver based on DIMM topology; maps directly to a physical memory slot in the system.mc_indexMemory controller index (0-based). Distinguishes between IMCs on servers with multiple memory controllers. top_layerTop-layer index in the memory hierarchy (typically the channel number; -1 indicates invalid). mid_layerMiddle-layer index in the memory hierarchy (typically the slot or rank number; -1 indicates invalid). low_layerBottom-layer index in the memory hierarchy (typically the bank or row number; -1 indicates invalid). addrPhysical memory address where the error occurred (64-bit unsigned integer; 0 indicates an invalid address). grainError granularity (grain size, in bytes). Represents the smallest memory unit that may be affected. Computed as 1 << GrainBits. For example,grain=8means the error is localized to an 8-byte unit (a cache line sub-block).syndromeECC syndrome value. driverEDAC driver name (e.g., "amd64_edac","sb_edac"). -
ACPI GHES
Monitored components: platform-specific hardware errors.
Field Description severityRaw ACPI/CPER error severity value. sec_typeError section type GUID (16 bytes, hexadecimal string). Defined by the UEFI specification and hardware vendors. Identifies the hardware category of the error record (e.g., memory error section, PCIe error section, ARM processor error section). fru_idFRU (Field Replaceable Unit) identifier GUID (16 bytes, hexadecimal string). Uniquely identifies the replaceable hardware component where the error occurred (e.g., a specific DIMM or PCIe card). fru_textHuman-readable FRU description string (e.g., "CPU0_DIMM_A1").data_lenRaw error data payload length (in bytes). raw_dataHexadecimal dump of raw error data (space-separated bytes). Used for in-depth diagnostics; must be interpreted with the relevant hardware vendor documentation. -
PCIe AER
Monitored devices include GPUs, NVMe SSDs, RDMA NICs/HCAs, FPGA accelerator cards, and PCIe switches.
Field Description dev_namePCIe device name (BDF format), e.g., "0000:03:00.0"(Domain:Bus:Device.Function).err_typeError severity level ( Corrected/Uncorrected/Fatal).err_reasonError reason description string. Decoded from the bits of the AER status register (see the tables below). tlp_headerTLP (Transaction Layer Packet) header quad-word that triggered the error (format: {dword0, dword1, dword2, dword3}, hexadecimal). The TLP header contains the transaction type, address, and requester ID — key data for root cause analysis. Displays"not available"whenTlpHeaderValid=0. -
PCIe Correctable Error Types
Bitmask Description 0x00000001Receiver Error. The physical layer received a data symbol that does not conform to the specification. Typically caused by signal integrity issues such as excessive cable length or impedance mismatch. 0x00000040Bad TLP. The LCRC (link-layer CRC) check on a TLP failed, indicating bit flips during transmission. The PCIe link layer automatically retransmits the TLP. 0x00000080Bad DLLP. A link-layer control packet (such as ACK/NAK or flow control update) failed its CRC check. 0x00000100Replay Number Rollover. The REPLAY_NUMfield tracks retransmit count. This error indicates too many retransmissions since the last ACK, typically signaling sustained poor link quality.0x00001000Replay Timer Timeout. The sender did not receive an ACK within the allowed time, triggering TLP retransmission. Persistent occurrence indicates abnormal link latency or insufficient receiver processing capacity. 0x00002000Advisory Non-Fatal Error. An uncorrectable error that software has downgraded to correctable (requires the ANFE feature in the AER capability). Commonly seen when an Unsupported Request Completion is received. 0x00004000Corrected Internal Error. An internal ECC or parity error that the device corrected autonomously. 0x00008000Header Log Overflow. The AER header log register is full. TLP headers for subsequent errors cannot be recorded, though errors are still counted. -
PCIe Uncorrectable Error Types
Bitmask Description 0x00000001Undefined. A reserved bit was set, typically indicating non-compliant firmware or hardware behavior. 0x00000010Data Link Protocol Error. A packet that violates the DLLP protocol specification was received. This is a severe link-layer fault. 0x00000020Surprise Down Error. The physical link disconnected without a Hot-Plug notification (e.g., due to unexpected power loss or poor contact). This is a high-severity error in hot-plug environments. 0x00001000Poisoned TLP. A TLP was received with the Error Poisoning (EP) bit set to 1, indicating that the upstream sender was aware of data corruption. This mechanism propagates and isolates errors to prevent silent data corruption. 0x00002000Flow Control Protocol Error. A packet that violates PCIe flow control credit rules was received. This is a severe protocol violation. 0x00004000Completion Timeout. The requester sent a non-posted transaction (e.g., Memory Read) but did not receive a Completion within the required timeout. Commonly caused by NVMe firmware issues, RDMA NIC driver bugs, or PCIe link interruptions. 0x00008000Completer Abort. The completer returned an explicit CA (Completer Abort) status, indicating that the request was rejected. 0x00010000Unexpected Completion. A Completion was received that could not be matched to any outstanding request (tag mismatch). Typically caused by device firmware bugs or data path errors. 0x00020000Receiver Overflow. The receiver’s flow control credits indicated available buffer space, but an overflow occurred. This is a severe flow control violation. 0x00040000Malformed TLP. The packet header contains fields that violate the specification (e.g., illegal length, reserved bits set, invalid address range). Typically indicates a severe firmware defect. 0x00080000ECRC Error. The ECRC check on the TLP trailer failed (requires ECRC support on both endpoints). Indicates data corruption across the entire transmission path, including internal PCIe switch fabric. A key metric in high-reliability environments. 0x00100000Unsupported Request. The completer returned a UR (Unsupported Request) status, indicating that the transaction type or address range is not supported by the device. 0x00200000ACS Violation. PCIe ACS (Access Control Services) prevents peer-to-peer DMA between PCIe devices from bypassing the IOMMU. This error indicates a data access that violates the ACS policy. Requires attention in virtualization security environments. 0x00400000Uncorrectable Internal Error. An internal ECC or parity error occurred that the device could not self-correct (e.g., SRAM double-bit error). Typically indicates hardware damage. 0x00800000MC Blocked TLP. A PCIe Multicast TLP was blocked by ACS or the Multicast control mechanism. 0x01000000AtomicOp Egress Blocked. An AtomicOp request (FetchAdd, Swap, or CAS) was blocked from egressing by ACS. Commonly seen in RDMA or GPU direct-connect configurations. 0x02000000TLP Prefix Blocked. A packet with an End-End TLP Prefix was blocked from forwarding by ACS or another mechanism.
Summary
Deploy HUATUO in production to enable hardware error monitoring and proactive operations.