Profiling Guide
Overview
This guide covers creating profiling tasks, collecting data with profiler, and querying and interpreting results. See Continuous Profiling for capabilities and use cases.
| Goal | Section |
|---|---|
| Run a remote CPU profile | Quick Start |
| Collect directly on the target node | CLI Collection |
| Choose output formats and analyze data | Results |
| Manage tasks programmatically | Profiling API |
| Look up defaults and limits | CLI Parameters |
Quick Start
Use Docker Compose to collect a host CPU profile and view its flame graph in Grafana.
1. Start Services
Follow Docker Deployment to prepare a Linux node, Docker Compose, and build/docker/.env. The example requires curl and jq; the target node should have CPU activity to analyze.
Write the settings below to huatuo-bamai.conf and huatuo-apiserver.conf in the repository root, which Compose mounts. huatuo-bamai writes profiles and huatuo-apiserver queries them; both must connect to the same ES index. Match the ES password to ELASTIC_PASSWORD in .env. Use the same node token in both files; the API token authenticates subsequent requests.
In huatuo-bamai.conf:
[HTTPServer.Auth]
    BearerToken = "REPLACE_WITH_NODE_TOKEN"

[Storage]
    [Storage.Elasticsearch]
        Address = "http://127.0.0.1:9200"
        Index = "huatuo_bamai"
        Username = "elastic"
        Password = "huatuo-bamai"
In huatuo-apiserver.conf:
[Agent.Auth]
    BearerToken = "REPLACE_WITH_NODE_TOKEN"

[Elasticsearch]
    Address = "http://127.0.0.1:9200"
    Username = "elastic"
    Password = "huatuo-bamai"
    Index = "huatuo_bamai"

[Auth]
    [[Auth.Users]]
        ID = "administrator"
        BearerToken = "REPLACE_WITH_RANDOM_HEX"
        Admin = true
Run from the repository root:
docker compose --project-directory ./build/docker up
This runs in the foreground. Use another terminal for the remaining steps.
The running components are:
| Service | Role | Default Port |
|---|---|---|
huatuo-bamai |
Collection agent; runs profiler sampling | 19704 |
huatuo-apiserver |
API entry point; creates and dispatches tasks and queries flame graphs | 12740 |
elasticsearch |
Stores profile data in index huatuo_bamai |
9200 |
grafana |
Displays flame graph dashboards | 3000 |
2. Check Services
Confirm the node and API services are accessible:
curl -fsS http://localhost:19704/version | jq .data.name
curl -fsS http://localhost:12740/version | jq .data.name
curl -fsS -u elastic:huatuo-bamai http://localhost:9200/ | jq .cluster_name
The first two checks should return huatuo-bamai and huatuo-apiserver, respectively; the third should return the ES cluster name. These checks establish accessibility only. Step 4 verifies collected results.
Set environment variables for subsequent requests:
API_BASE="http://127.0.0.1:12740"
API_TOKEN="REPLACE_WITH_RANDOM_HEX"
3. Create a Task
This example uses language c (native collection, covering C/C++/Go) to sample the whole host for 30 seconds:
# Use the node hostname reported by huatuo-bamai
TARGET_HOST="REPLACE_WITH_NODE_HOSTNAME"

JOB_ID=$(curl -fsS -X POST \
  -H "Authorization: Bearer ${API_TOKEN}" \
  -H "Content-Type: application/json" \
  -d "{
    \"type\": \"cpu\",
    \"language\": \"c\",
    \"mode\": \"oncpu\",
    \"scope\": \"host\",
    \"duration_seconds\": 30,
    \"hostname\": \"${TARGET_HOST}\"
  }" \
  "${API_BASE}/v1/profiling" | jq -er .data.request_id)

echo "Job ID: $JOB_ID"
4. Verify Results
Query status using the returned JOB_ID. Collection duration excludes queueing and result submission; use the task status to determine completion:
curl -fsS -H "Authorization: Bearer ${API_TOKEN}" \
  "${API_BASE}/v1/profiling/${JOB_ID}" | jq '.data | {status, terminal, result_url}'
Normal completion reports status=terminal and terminal.outcome=completed. If still pending or running, check again later. On failure, use terminal.reason and terminal.message to investigate the node and collection tool.
After the task ends, read one page of its raw results:
curl -fsS -H "Authorization: Bearer ${API_TOKEN}" \
  "${API_BASE}/v1/profiling/${JOB_ID}/raw?limit=1&offset=0" | jq .data
A successful response means the result is published. items may be empty, for example if collection produced no valid samples. Do not infer task success from the entire index’s document count. See API Result Queries for error codes and pagination.
5. View the Flame Graph
This example profiles the local host. Open Continuous Profiling, shared by host and container scopes:
- URL: http://localhost:3000/d/continuous-profiling. Replace
localhost:3000for your environment. - Username/password:
admin / admin. Change the password when prompted on first login.
Steps:
- Select a time range in the upper-right corner covering the collection period.
- Select Region, the node
hostname, scopehost, and this Task ID, then chooseprocess_cpu:cpu:nanoseconds:cpu:nanosecondsastype. - Inspect aggregated stacks for the task and time range; use Focus block to focus on a frame.
- Choose Both to show the flame graph and function statistics together.
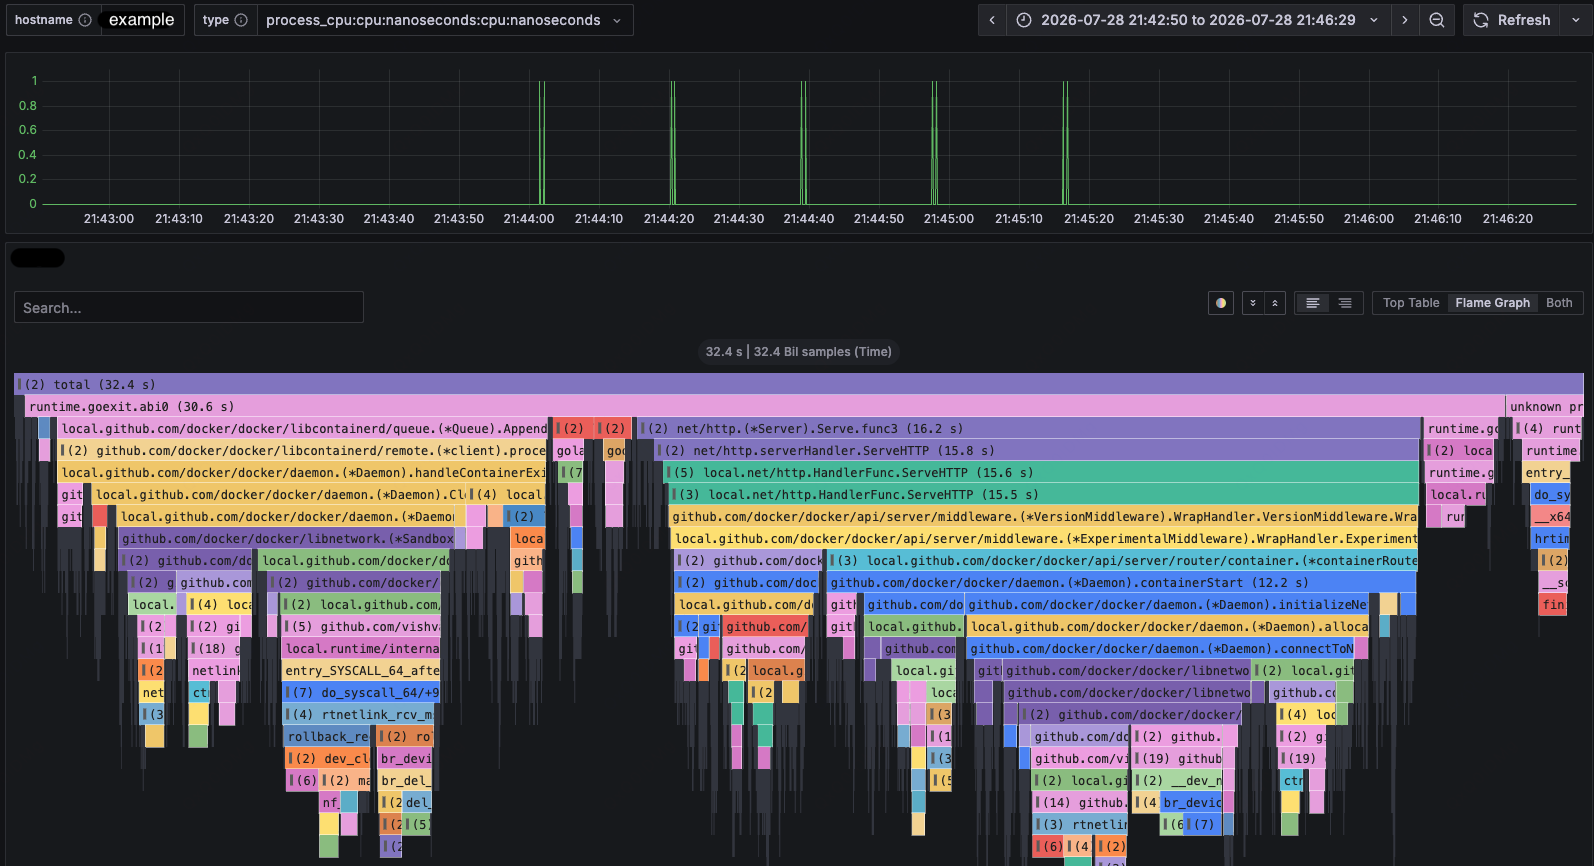
After the local trial, run docker compose --project-directory ./build/docker down from the repository root to stop and remove these Compose services.
CLI Collection
profiler can collect and produce local results without an API server, Elasticsearch, or Grafana. Replace the example PIDs, container IDs, and tool paths with real targets before running.
Prerequisites
Build the complete artifacts from the repository root:
make build
The binary is _output/bin/profiler. Native collection requires Linux eBPF, perf events, and the project’s built BPF objects. It usually requires root privileges and a kernel.perf_event_paranoid setting that allows sampling. Java requires async-profiler; --tool-path points to a shared tool root containing bin/asprof and lib/libasyncProfiler.so. Python uses py-spy under the same root.
View full help for the current version:
_output/bin/profiler --help
Basic command structure:
sudo _output/bin/profiler \
  --type <cpu|memory> \
  --language <c|c++|go|java|python> \
  --pid <pid> \
  --duration 30 \
  --aggr-interval 10 \
  --output-format flamegraph \
  --output-path ./profiles/
--type and --language are required. Java, Python, and native memory collection require exactly one of --pid or --container-id. Native CPU collection can sample the host without a target.
Container targets also require access to the huatuo-bamai node API to resolve container metadata. Set its address with --huatuo-api-address.
C, C++, and Go
C, C++, and Go use the native eBPF collector; change only --language. On-CPU mode converts samples to CPU time using the sampling frequency and includes resolvable user and kernel stacks.
sudo _output/bin/profiler \
  --type cpu \
  --language go \
  --pid 12345 \
  --duration 30 \
  --aggr-interval 10 \
  --freq 99 \
  --output-format flamegraph \
  --output-path ./profiles/go-cpu/
Add --thread-group to include worker threads in the same process, or --cpuid 2,4-7 to restrict CPUs. Native CPU collection also supports container and host scopes:
Native on-CPU collection prefers hardware CPU cycle events and falls back to software CPU clock when the hardware PMU is unavailable. --freq means samples per second with either source. Use --require-hardware-pmu if software-clock fallback would hide CPU time spent with IRQs disabled.
# Collect a specific container
sudo _output/bin/profiler \
  --type cpu --language c --container-id <container-id> \
  --duration 30 --aggr-interval 10 \
  --output-format collapsed --output-path ./profiles/container/

# Collect the host without specifying a PID or container
sudo _output/bin/profiler \
  --type cpu --language c \
  --duration 30 --aggr-interval 10 \
  --output-format flamegraph --output-path ./profiles/host/
Use off-CPU mode to attribute time away from the CPU to the call path that caused the switch-out:
sudo _output/bin/profiler \
  --type cpu --language go --pid 12345 --thread-group \
  --cpu-mode offcpu --offcpu-phase all \
  --cpuid 2,4-7 \
  --offcpu-min-duration-us 1000 \
  --duration 30 --aggr-interval 10 \
  --output-format flamegraph --output-path ./profiles/go-offcpu/
Off-CPU collection is event-driven and does not use --freq. With --cpuid, only intervals starting with a switch-out on a target CPU are recorded; later wakeups or switch-ins on other CPUs do not change attribution. Flame graphs use nanosecond values directly and add roots such as off-CPU blocked, scheduling delay (preempted), and scheduling delay (yielded). Phase all accumulates both blocked and runqueue time while displaying them under separate roots.
Native memory collection supports:
--memory-mode |
Measurement | Use Case |
|---|---|---|
virtual_alloc |
Virtual address space allocations and their stacks | Excessive virtual allocation such as mmap, or address-space growth |
physical_alloc |
Physical memory allocated during the collection window | Page-fault allocation hotspots and allocation-rate analysis |
physical_usage |
Live bytes of physical pages tracked in this collection | Locate sampled live pages by allocation stack; not full RSS |
Cross-period stack matching, page-free detection, and shutdown data collection for physical_usage still require validation. Results must not be treated as exact physical residency. Read the Live Physical Memory limitations before using this mode.
sudo _output/bin/profiler \
  --type memory \
  --language c++ \
  --memory-mode physical_usage \
  --pid 12345 \
  --thread-group \
  --physical-memory-probability 100 \
  --duration 30 \
  --aggr-interval 10 \
  --output-format flamegraph \
  --output-path ./profiles/native-memory/
--physical-memory-probability applies only to physical_alloc and physical_usage. Lower values reduce processing of frequent memory events. physical_alloc estimates allocation volume from the sampling probability. physical_usage counts only tracked pages, without inverse-probability scaling or pages allocated before collection.
Verify the output: Local Results.
Java
Java CPU collection requires async-profiler and supports one PID, a container, or multiple PIDs:
_output/bin/profiler \
  --type cpu \
  --language java \
  --pid 12345,12346 \
  --tool-path /opt/huatuo/tools \
  --max-concurrent-procs 2 \
  --duration 30 \
  --aggr-interval 10 \
  --freq 99 \
  --output-format flamegraph \
  --output-path ./profiles/java-cpu/
Java class names use dots, such as java.lang.Thread.run. Allocation object types do not retain color markers for inside/outside TLAB. Objects of the same type in the same stack are combined by bytes. Actual kernel frames retain the _[k] suffix.
Java memory collection supports:
--memory-mode |
Measurement | Use Case |
|---|---|---|
object_alloc |
Object allocations and allocation stacks during the window | High allocation rates, short-lived objects, and sources of GC pressure |
object_usage |
Live objects and their allocation stacks | Long-lived objects, heap usage, and suspected memory leaks |
_output/bin/profiler \
  --type memory \
  --language java \
  --memory-mode object_usage \
  --pid 12345 \
  --tool-path /opt/huatuo/tools \
  --duration 30 \
  --aggr-interval 10 \
  --output-format flamegraph \
  --output-path ./profiles/java-memory/
For a container target, replace --pid with --container-id <container-id>. If it contains multiple candidate processes, select the executable path with --binary-match-path.
Verify the output: Local Results.
Python
Python currently supports CPU observation only. --aggr-interval must equal --duration, producing one aggregation window per collection. --tool-path points to the shared tool root containing py-spy.
_output/bin/profiler \
  --type cpu \
  --language python \
  --pid 12345,12346 \
  --tool-path /opt/huatuo/tools \
  --max-concurrent-procs 2 \
  --duration 30 \
  --aggr-interval 30 \
  --freq 99 \
  --output-format flamegraph \
  --output-path ./profiles/python-cpu/
Verify Local Results
Before collecting, confirm that the target process is running and exercise the requests or operations you want to analyze during collection. Use a separate output directory for this run to avoid mistaking older files for new results.
- Confirm that the command finishes successfully, and check for collection errors, output errors, or sample-loss warnings.
- After a successful Go CPU run with valid samples, check for
profiles/go-cpu/flamegraph_<Unix timestamp>.svg. Use the corresponding output directory for other examples. - Open the new SVG in a browser, search for expected application functions, and inspect their stacks and values. CPU and wait times use nanoseconds; memory uses bytes. See Flame Graphs for interpretation.
If no file appears, results are empty, or target stacks are missing, check the PID, container, thread, and CPU filters. Confirm that target activity occurred during collection, then check permissions, tool dependencies, and error logs.
A run with no samples may produce no display file; an existing file alone does not prove success or complete data. See Live Physical Memory for empty results when memory allocation and release values cancel out.
Results
Output Formats
| Format | Output | When to Use |
|---|---|---|
collapsed |
perf_<Unix timestamp>.folded; semicolon-separated frames followed by a numeric value |
Scripted searches, comparisons, or rendering with other flame graph tools |
flamegraph |
flamegraph_<Unix timestamp>.svg; SVG with interactive scripts |
Recommended for visual analysis; search, zoom, and inspect frame values in a browser |
svg |
Same interactive SVG as flamegraph |
For callers explicitly requesting SVG; currently equivalent to flamegraph |
json |
One JSON line per collection window; streaming collection may emit multiple lines | Preserve windows, sample labels, and signed values |
remote-store |
Uploads pprof-compatible data through a Unix socket without a local flame graph | HUATUO storage integration; not for offline viewing |
Flame Graphs
A flame graph shows call direction from bottom to top. Rectangle width represents the accumulated value for a stack in the selected measurement. On-CPU widths represent estimated CPU time; off-CPU widths represent blocked or scheduling-wait time. Memory widths represent bytes for the selected memory mode. Horizontal position is not chronological.
Collapsed-stack example:
main;handleRequest;parsePayload 428
main;handleRequest;writeResponse 172
remote-store requires the HUATUO toolstream Unix socket and a nonempty --task-id.
Collection Windows
--duration sets total collection time; --aggr-interval sets the aggregation period. Native CPU, memory, and Java collectors process data periodically; Python outputs once at the end. Window times describe receipt and aggregation intervals, not exact per-sample execution times.
Stacks are aggregated by user stack, kernel stack, and the complete label set. CPU and wait times use nanoseconds; memory uses bytes. comm is only the process command name. Java and Python entry points are stored in java_entry and python_entry labels.
collapsed, flamegraph, and svg produce final aggregates after successful collection. json preserves each window and signed values. Display formats clamp negative cumulative sample values to zero and log a warning. Stored labels do not imply that query APIs support arbitrary label indexing or filtering.
Live Physical Memory
physical_usage measures live bytes of physical pages tracked during this collection. It excludes pages allocated earlier and applies no inverse-probability scaling, so it is not the process’s full RSS.
The remote type is memory:physical_usage:bytes:space:bytes. Each output period stores the current snapshot with zero duration. Queries must specify one Task ID and select only the latest snapshot in the time range. Do not sum snapshots or fall back to an older nonzero result. Grafana scopes the task through a Task ID field.
Local SVG and collapsed stacks show the final accumulated result; JSON retains signed deltas per period. Fully canceled samples still produce a valid empty result. If no samples were ever received, no local display file is created.
Normal shutdown reads the remaining buffered data, but tail completeness in the real sampling path still requires validation. Cross-period stack matching and detection of actual and partial physical-page frees still require validation and improvement. Current results must not be treated as exact physical residency. Memory usage for high-cardinality collection also grows with the number of distinct samples.
Task Completion
After the collection duration or SIGINT (Ctrl+C), the CLI stops collection, reads and delivers final samples, drains the queue, and submits the result. Final processing shares a 30-second budget. Exceeding it, receiving other cancellation signals, or encountering collection or output errors prevents result submission. Resource cleanup still runs; external tool cleanup has its own timeout.
API stop requests abort tasks without publishing a result completion marker. See Stop a Task for result rules. Output is not transactional: windows or local data written before failure may remain.
Remote results receive a completion marker only after remote-store commits them. Raw task-result queries depend on this marker. General flame graph queries do not guarantee exclusion of all incomplete windows, so chart data alone does not prove task success. Upgrade receivers before senders in the remote collection path. Unified windows use application protocol version 3; legacy versions 1/2 support only the older complete pprof payloads.
Sample Loss
Collection loss is recorded under collection in profile_data.metrics.dropped_samples. A full user-space queue waits for aggregation to make space or for the processing context to be canceled, without silently dropping data; aggregation_queue exists only for historical compatibility. physical_usage fails on explicit sample loss; other types may retain loss statistics. Cancellation does not guarantee export of final statistics, so empty results or missing loss fields do not alone prove no loss.
Profiling API
See the Profiling API for task creation, queries, result pagination, and stopping rules.
CLI Parameters
See profiler CLI Parameters for defaults, limits, and applicable modes.
Integration Tests
For reproducible workloads and stack assertions, see Profiling Integration Tests.