4.1 - huatuo-bamai 配置
1. 文档概述
huatuo-bamai 作为 HUATUO 的核心采集器(bpf-based metrics and anomaly inspector),其配置文件用于定义数据采集范围、探针启用策略、指标输出格式、异常检测规则、以及日志行为等。
配置文件包含全局黑名单、日志、运行时资源限制、存储配置以及自动追踪(AutoTracing)等多个 section。每个配置项均附带详细注释,明确说明用途、默认值及注意事项。本文档针对配置文件中的每一个配置项提供中文的详细解释,帮助用户准确理解和安全定制配置。
注意:配置文件中多数参数以 # 注释形式提供默认值,实际启用时需移除 # 并根据环境调整。修改后需重启 huatuo-bamai 进程生效。生产环境建议遵循最小化原则,避免过度开启高开销特性。
2. 全局黑名单
# Global tracing and metrics configuration.
#
# - BlackList
# Global blacklist for tracing and metrics.
#
BlackList = ["netdev_hw", "netdev_qdisc", "metax_gpu", "ascend_npu", "diskio", "tcp_retransmit", "mthreads_gpu"]
-
BlackList:全局追踪与指标黑名单。
用于排除特定模块的追踪和指标采集,避免无关噪声或高开销探针。默认值为 ["netdev_hw", "netdev_qdisc", "metax_gpu", "ascend_npu", "diskio", "tcp_retransmit", "mthreads_gpu"],即全局禁用网络设备硬件层(netdev_hw)、队列调度统计(netdev_qdisc)、Metax GPU、Ascend NPU、基于 procfs 的磁盘 I/O 指标、TCP 重传追踪和摩尔线程 GPU 监控。需要启用磁盘 I/O 指标时从黑名单中移除 diskio;需要启用 TCP 重传追踪时移除 tcp_retransmit;需要启用摩尔线程 GPU 指标采集时移除 mthreads_gpu(要求已安装 MTML 库)。local 关联不依赖 standalone dropwatch tracer。
说明:添加黑名单项可有效降低资源消耗,尤其在特定硬件环境中;支持数组格式,可根据实际业务扩展。
3. 日志配置
# Log Configuration
[Log]
# - Level
# The log level for huatuo-bamai: Debug, Info, Warn, Error, Panic.
# Default: Info
#
# - File
# Store logs to where the logging file is. If it is empty, don't write log
# to any file.
# Default: empty
#
# Level = "Info"
# File = ""
-
Level:日志级别。
可选值包括 Debug、Info、Warn、Error、Panic。默认值为 Info。
说明:控制 huatuo-bamai 的日志输出详细程度。生产环境推荐使用 Info 或 Warn 以减少日志量;Debug 级别仅用于故障排查,会产生大量输出。
-
File:日志文件路径。
指定日志写入的文件路径。若为空字符串,则不写入文件(仅输出到标准输出或系统日志)。默认值为空。
说明:在容器化部署中,建议配置具体路径进行持久化。
4. 运行时资源限制
默认不创建 Huatuo 自身 cgroup。只有显式传入 --enable-cgroup 时,本节配置才会生效;Kubernetes 和 systemd 部署应使用各自的资源管理配置。
# Runtime limits for the huatuo-bamai process.
[Runtime]
# - StartupCPULimitCores
# CPU limit during startup, in cores.
# Default: 0.5
#
# - CPULimitCores
# CPU limit after startup, in cores.
# Default: 2.0
#
# - MemoryLimitMiB
# Memory limit in MiB.
# Default: 2048
#
# StartupCPULimitCores = 0.5
# CPULimitCores = 2.0
# MemoryLimitMiB = 2048
- StartupCPULimitCores:初始化阶段 CPU 上限,默认
0.5 核。
- CPULimitCores:启动完成后的 CPU 上限,默认
2.0 核。
- MemoryLimitMiB:进程内存上限,默认
2048 MiB。
配置始终以文档标明的单位保存,仅在应用 cgroup 限制时将内存转换为字节。
5. HTTP 服务与按需 Operation
# HTTP server configuration.
[HTTPServer]
# - ListenAddress
# Listen address in "host:port" form.
# Default: ":19704"
#
# - MaxEventStreamClients
# Maximum number of concurrent clients allowed to hold an open
# /v1/events/watch SSE connection. Once the limit is reached, new requests
# are rejected with HTTP 429 until an existing client disconnects.
# Default: 100
#
# - EventStreamKeepAliveIntervalSeconds
# Interval in seconds at which the server sends an SSE comment ping to each
# connected client. The ping keeps the connection alive through load
# balancers and proxies that would otherwise time out idle connections. If
# writing the ping fails three consecutive times, the server closes the
# connection.
# Default: 30
#
# ListenAddress = ":19704"
# MaxEventStreamClients = 100
# EventStreamKeepAliveIntervalSeconds = 30
[HTTPServer.Auth]
# huatuo-apiserver 调用 Node API 时使用的必填服务凭证。
BearerToken = "REPLACE_WITH_RANDOM_HEX"
# Profiling 和 Tracing 共用的生命周期策略。
[Operations]
# MaxConcurrent = 10
# LaunchTimeoutSeconds = 10
# StopGracePeriodSeconds = 5
# FinalizationTimeoutSeconds = 30
# TerminalRetentionPeriodSeconds = 600
# Node 本地 Profiling 执行配置。
[Profiling]
# AggregationIntervalSeconds = 10
# MaxConcurrentProcesses = 10
# CommandOutputLimitBytes = 65536
# ToolDir = "/opt/huatuo/tools"
- ListenAddress 使用
host:port 格式,主机为空时监听所有接口。
- HTTPServer.Auth.BearerToken 必填,并且必须与 huatuo-apiserver 独立配置的
Node 凭证一致;部署前必须替换示例值。
- Operations.MaxConcurrent 是 Profiling、Tracing 共用的进程级上限;容量用尽时
直接拒绝新 Operation,不在 Node 排队。
- 四个 Operation 时间参数分别限制进程启动、优雅停止、结果收尾和终态保留,不能
合并为一个通用 timeout。
- Profiling.ToolDir 是外部采样工具的统一根目录,原样传给 profiler 的
--tool-path。Java 使用该目录下的 bin/asprof 和
lib/libasyncProfiler.so,Python 使用 py-spy。
只检查请求语言所需的工具;原生采集不需要此配置。Node 环境不满足要求时
拒绝请求且不创建 Operation。
生成的 Node API 通过 GET /openapi.json 提供协议文档。Profiling、Tracing 的
Start、Get、Stop 路由、POST /v1/events/watch 及 PUT /v1/config 必须携带
服务 Bearer Token;/readyz、指标、版本和 OpenAPI 文档保持公开。
5.1 通过 Node API 更新配置
PUT /v1/config 接收一个非空的 config 对象。键名使用与 TOML 结构一致的
点分路径,值保留 JSON 类型:
curl -i -X PUT 'http://127.0.0.1:19704/v1/config' \
-H 'Authorization: Bearer REPLACE_WITH_RANDOM_HEX' \
-H 'Content-Type: application/json' \
--data '{
"config": {
"BlackList": ["dropwatch", "netdev_hw"],
"Runtime.CPULimitCores": 1.5,
"Runtime.MemoryLimitMiB": 1024
}
}'
更新成功返回 204 No Content。Node Agent 先校验完整的候选配置,再原子替换
配置文件,最后发布新的内存快照。校验或持久化失败时,当前快照保持不变。
未知键、无效值类型和空更新对象返回 400 Bad Request。
动态读取配置的组件无需重启即可观察到新快照。HTTP 监听与鉴权、存储初始化、
cgroup 设置等仅在启动阶段读取的配置会被持久化,但需重启 huatuo-bamai 后
才能生效。
事件流配置控制 POST /v1/events/watch。达到
MaxEventStreamClients 后,新连接返回 HTTP 429。
EventStreamKeepAliveIntervalSeconds 控制 SSE 心跳注释间隔,用于避免
代理或负载均衡器关闭空闲连接。连续三次写入失败后服务端关闭连接。
该值应小于上游 idle timeout,生产环境通常设置为 15–60 秒。
6. 存储配置
6.1 ElasticSearch/OpenSearch 存储
# Storage configuration
[Storage]
# Elasticsearch and OpenSearch Storage
#
# Disable ES/OS storage if one of Address, Username, Password is empty.
# Store the tracing and events data of linux kernel to ES/OS.
#
# - Address
# Port 9200 is commonly used for Elasticsearch/OpenSearch HTTP APIs.
# e.g.
# http://127.0.0.1:9200
# https://127.0.0.1:9200
#
# - Index
# Elasticsearch or OpenSearch index, a logical namespace that holds a collection of
# documents for huatuo-bamai.
# Default: huatuo_bamai
#
# - Username
# - Password
# Address, Username, and Password must be either all empty (disabled) or
# all configured (enabled). Partial connection settings are invalid.
#
[Storage.Elasticsearch]
# Address = "http://127.0.0.1:9200"
# Index = "huatuo_bamai"
# Username = "elastic"
# Password = "REPLACE_WITH_PASSWORD"
-
Address:ElasticSearch/OpenSearch 存储服务地址。
无默认值。
说明:用于存储内核追踪和事件数据。Address、Username、Password
三项全部为空时禁用 ES/OS 存储;启用时必须三项全部配置,部分配置会
导致进程启动失败。支持 HTTP/HTTPS 协议。
-
Index:索引名称。
默认值为 huatuo_bamai。
说明:索引是 ElasticSearch/OpenSearch 文档的逻辑命名空间,用于组织 huatuo-bamai 产生的追踪与事件数据。
-
Username:用户名。
无默认值。
说明:用于 Basic Auth 认证。
-
Password:认证密码。
无默认值。
说明:配合用户名进行安全认证。生产环境强烈建议使用强密码并结合 TLS 加密传输。
整体说明:ES/OS 存储用于持久化内核追踪和事件数据,便于后续检索与分析。如果用户不关心 Linux 内核事件、Autotracing 数据则可以关闭该配置。
6.2 本地文件存储
# LocalFile Storage
#
# Store data to local directory for troubleshooting on the host machine.
#
# - Path
# The directory for storing data. If the Path is empty, LocalFile will be disabled.
# Default: "huatuo-local"
#
# - RotationSizeMiB
# The maximum size in Megabytes of a record file before it gets rotated
# for per linux kernel tracer.
# Default: 100MB
#
# - MaxRotatedFiles
# The maximum number of old log files to retain for per tracer.
# Default: 10
#
[Storage.LocalFile]
# Path = "huatuo-local"
# RotationSizeMiB = 100
# MaxRotatedFiles = 10
-
Path:本地数据存储目录。
默认值为 huatuo-local。若路径为空,则禁用本地文件存储。
说明:用于在宿主机本地保存数据,主要用于现场故障排查。推荐配置为绝对路径。
-
RotationSizeMiB:单文件轮转大小。
每个追踪器记录文件在达到该大小时进行轮转。默认值为 100 MB。
说明:单位为 MB,防止单个文件过大导致磁盘占用失控。
-
MaxRotatedFiles:最大保留轮转文件数。
每个追踪器最多保留的历史文件数量。默认值为 10。
说明:超过数量后自动删除最早文件,控制磁盘空间使用。
7. 自动追踪配置
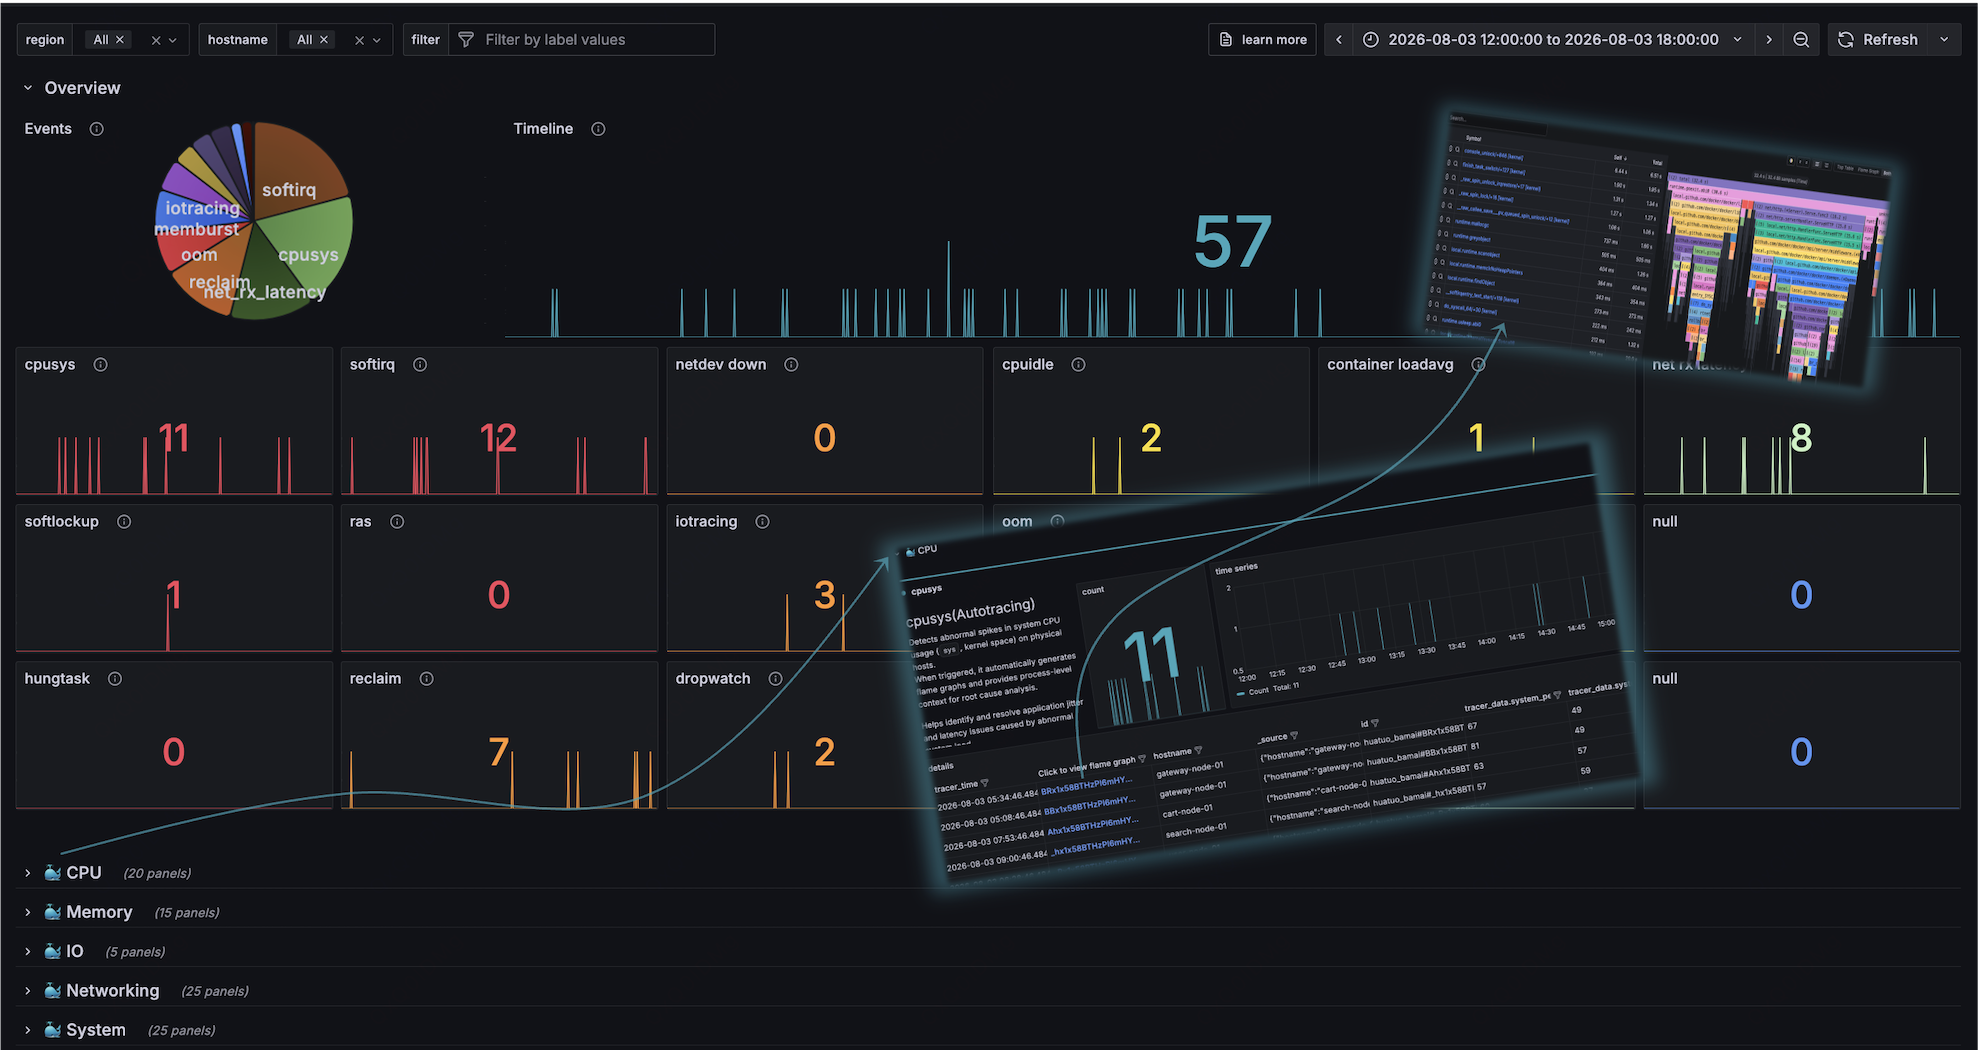
自动追踪模块是 HUATUO 的智能特性之一,可根据阈值自动触发特定性能追踪,减少人工干预。
7.1 CPUIdle 自动追踪 — 容器突发高 CPU 使用场景
# Autotracing configuration
[AutoTracing]
# cpuidle
#
# For a high cpu usage all of a sudden in containers.
#
# - UserThreshold
# User CPU usage threshold, when cpu usage reaches this threshold, cpu
# performance tracing will be triggered.
# Default: 75%
#
# - SysThreshold
# System CPU usage threshold, when reaching this threshold, cpu performance
# tracing will be triggered.
# Default: 45%
#
# - UsageThreshold
# The total cpu usage (system + user cpu usage) threshold, when reaching
# this threshold, cpu performance tracing will be triggered.
# Default: 45%
#
# - DeltaUserThreshold
# The range of this user cpu changes within a short period of time.
# Default: 45%
#
# - DeltaSysThreshold
# The range of this system cpu changes within a short period of time.
# Default: 20%
#
# - DeltaUsageThreshold
# The range of this cpu usage changes within a short period of time.
# Default: 55%
#
# - Interval
# The sample interval of the cpu usage for all containers.
# Default: 10s
#
# - IntervalTracing
# Time since last run. Avoid frequently executing this tracing to prevent
# damage to the system.
# Default: 1800s
#
# - RunTracingToolTimeout
# The executing time of this tracing program.
# Default: 10s
#
# NOTE:
# Running this performance tool, when:
# 1. UserThreshold and DeltaUserThreshold are true, or
# 2. SysThreshold and DeltaSysThreshold are true, or
# 3. UsageThreshold and DeltaUsageThreshold
#
[AutoTracing.CPUIdle]
# UserThreshold = 75
# SysThreshold = 45
# UsageThreshold = 90
# DeltaUserThreshold = 45
# DeltaSysThreshold = 20
# DeltaUsageThreshold = 55
# Interval = 10
# IntervalTracing = 1800
# RunTracingToolTimeout = 10
-
UserThreshold:用户态 CPU 使用率阈值(%)。
默认 75%。 当容器用户态 CPU 使用率达到该值时,可能触发 CPU 性能追踪。
-
SysThreshold:系统态 CPU 使用率阈值(%)。
默认 45%。 当系统态 CPU 使用率达到该值时,可能触发追踪。
-
UsageThreshold:总 CPU 使用率阈值(用户态 + 系统态,%)。
默认 90%(注释中示例)。 总 CPU 使用率达到该阈值时触发追踪。
-
DeltaUserThreshold:用户态 CPU 短期变化幅度阈值(%)。
默认 45%。 短时间内用户态 CPU 使用率变化超过该值时触发。
-
DeltaSysThreshold:系统态 CPU 短期变化幅度阈值(%)。
默认 20%。 短时间内系统态 CPU 使用率变化超过该值时触发。
-
DeltaUsageThreshold:总 CPU 使用率短期变化幅度阈值(%)。
默认 55%。 短时间内总 CPU 使用率变化超过该值时触发。
-
Interval:CPU 使用率采样间隔(秒)。
默认 10s。 对所有容器进行 CPU 使用率采样的周期。
-
IntervalTracing:连续运行间隔(秒)。
默认 1800s(30 分钟)。 两次自动追踪之间的最小间隔,防止频繁执行对系统造成压力。
-
RunTracingToolTimeout:单次性能追踪执行超时时间(秒)。默认 10s。 控制追踪程序的最长运行时间,避免长时间占用资源。
触发逻辑说明:当满足以下任一条件时触发追踪:
- UserThreshold 与 DeltaUserThreshold 同时满足;或
- SysThreshold 与 DeltaSysThreshold 同时满足;或
- UsageThreshold 与 DeltaUsageThreshold 同时满足。
Filter 容器过滤:通过 Included/Excluded 规则数组控制监控范围。
# 每条规则包含 Field(过滤字段)和 Pattern(正则)
# Field: container_host_namespace | container_hostname | container_qos
#
# [[AutoTracing.CPUIdle.Filter.Excluded]]
# Field = "container_qos"
# Pattern = "besteffort"
# [[AutoTracing.CPUIdle.Filter.Included]]
# Field = "container_host_namespace"
# Pattern = "^application-"
7.2 CPUSys 自动追踪 — 宿主机突发高系统 CPU 使用场景
# cpusys
#
# For a high system cpu usage all of a sudden on host machine.
#
# - SysThreshold
# System CPU usage threshold, when reaching this threshold, cpu performance
# tracing will be triggered.
# Default: 45%
#
# - DeltaSysThreshold
# The range of system cpu changes within a short period of time.
# Default: 20%
#
# - Interval
# The sample interval of the cpu usage for host machine.
# Default: 10s
#
# - IntervalTracing
# Minimum time between profiling runs.
# Default: 1800s
#
# - RunTracingToolTimeout
# The executing time of this tracing program.
# Default: 10s
#
# NOTE:
# Running this performance tool, when:
# SysThreshold and DeltaSysThreshold are true.
#
[AutoTracing.CPUSys]
# SysThreshold = 45
# DeltaSysThreshold = 20
# Interval = 10
# IntervalTracing = 1800
# RunTracingToolTimeout = 10
-
SysThreshold:系统态 CPU 使用率阈值(%)。
默认 45%。
-
DeltaSysThreshold:系统态 CPU 短期变化幅度阈值(%)。
默认 20%。
-
Interval:宿主机 CPU 使用率采样间隔(秒)。
默认 10s。
-
IntervalTracing:两次性能剖析之间的最短间隔,默认 1800s。
-
RunTracingToolTimeout:单次追踪执行超时时间(秒)。默认 10s。
触发逻辑:当 SysThreshold 与 DeltaSysThreshold 同时满足时触发。
7.3 Dload 自动追踪 — 容器 D 状态任务剖析
# dload
#
# linux tasks D state profiling for containers.
#
# - ThresholdLoad
# The loadavg threshold value, when reaching this threshold, dload profiling
# is triggered.
# Default: 5
#
# - Interval
# The sample interval of the load for all containers.
# Default: 10s
#
# - IntervalTracing
# Time since last run. Avoid frequently executing this tracing to prevent
# damage to the system.
# Default: 1800s
#
[AutoTracing.Dload]
# ThresholdLoad = 5
# Interval = 10
# IntervalTracing = 1800
-
ThresholdLoad:容器的系统负载平均值(loadavg)阈值。
默认 5。 当 loadavg 达到该值时,触发 D 状态(不可中断睡眠)任务剖析。
说明:用于诊断容器中大量进程进入 D 状态的场景。
-
Interval:监控间隔(秒)。
默认 10。 Dload 监控的周期。
-
IntervalTracing:连续运行间隔(秒)。
默认 1800s(30 分钟)。 两次自动追踪之间的最小间隔,防止频繁执行对系统造成压力。
7.4 IOTracing 自动追踪 — 容器 IO 性能剖析
# iotracing
#
# io profiling for containers.
#
# - WbpsThreshold
# Max write bytes per second, when reaching this threshold, iotracing is triggered.
# Please note that if it is an NVMe device, it must also meet the UtilThreshold.
# Default: 1500 MB/s
#
# - RbpsThreshold
# Max read bytes per second, when reaching this threshold, iotracing is triggered.
# Please note that if it is an NVMe device, it must also meet the UtilThreshold.
# Default: 2000 MB/s
#
# - UtilThreshold
# Disk utilization, Percentage of time the disk is busy. If this is consistently
# above 80-90%, the disk may be a bottleneck.
# Default: 90%
#
# - AwaitThreshold
# Await (Average IO wait time in ms): High values indicate slow disk response times.
# Default: 100ms
#
# - RunTracingToolTimeout
# The executing time of this tracing tool.
# Default: 10s
#
# - MaxProcDump
# The number of processes displayed by iotracing tool.
# Default: 10
#
# - MaxFilesPerProcDump
# The number of files per process displayed by iotracing tool.
# Default: 5
#
[AutoTracing.IOTracing]
# WbpsThreshold = 1500
# RbpsThreshold = 2000
# UtilThreshold = 90
# AwaitThreshold = 100
# RunTracingToolTimeout = 10
# MaxProcDump = 10
# MaxFilesPerProcDump = 5
-
WbpsThreshold:每秒最大写字节数阈值(MB/s)。
默认 1500 MB/s。 达到该值时可能触发 IO 追踪(NVMe 设备需同时满足 UtilThreshold)。
-
RbpsThreshold:每秒最大读字节数阈值(MB/s)。
默认 2000 MB/s。 类似写字节,达到阈值时触发。
-
UtilThreshold:磁盘利用率阈值(%)。
默认 90%。 磁盘忙碌时间百分比,持续高于 80-90% 可能成为瓶颈。
-
AwaitThreshold:平均 IO 等待时间阈值(ms)。
默认 100ms。 高值表示磁盘响应缓慢。
-
RunIOTracingTimeout:IO 追踪工具执行超时时间(秒)。
默认 10s。
-
MaxProcDump:IO 追踪显示的最大进程数。
默认 10。 控制输出中展示的进程数量。
-
MaxFilesPerProcDump:每个进程显示的最大文件数。
默认 5。 控制每个进程关联文件的展示数量。
说明:IOTracing 用于容器 IO 热点诊断,特别关注高负载磁盘场景。
7.5 内存突发自动追踪
该模块用于检测宿主机内存使用量突发增长场景,并在触发时自动捕获内核上下文,便于诊断内存压力事件。
# memory burst
#
# If there is a memory used burst on the host, capture this kernel context.
#
# - Interval
# The sample interval of the memory used.
# Default: 10s
#
# - DeltaMemoryBurst
# A certain percentage of memory burst used. 100% that means, e.g.,
# memory used increased from 200MB to 400MB.
# Default: 100%
#
# - DeltaAnonThreshold
# A certain percentage of anon memory burst used. 100% that means, e.g.,
# anon memory used increased from 200MB to 400MB.
# Default: 70%
#
# - IntervalTracing
# Time since last run. Avoid frequently executing this tracing
# to prevent damage to the system.
# Default: 1800s
#
# - DumpProcessMaxNum
# How many processes to dump when this event is triggered.
# Default: 10
#
[AutoTracing.MemoryBurst]
# DeltaMemoryBurst = 100
# DeltaAnonThreshold = 70
# Interval = 10
# IntervalTracing = 1800
# SlidingWindowLength = 60
# DumpProcessMaxNum = 10
-
DeltaMemoryBurst:内存使用量突发增长百分比阈值。
默认 100%。 表示内存使用量在采样窗口内增长的比例(例如从 200MB 增长到 400MB 即 100%)。达到该阈值时可能触发内存突发追踪。
说明:用于捕获整体内存使用量的急剧上升场景。
-
DeltaAnonThreshold:匿名页内存突发增长百分比阈值。
默认 70%。 匿名内存(anonymous memory)增长比例阈值,匿名页是内存压力诊断的重要指标。
说明:重点监控易导致 OOM 或 swap 的匿名内存突发。
-
Interval:内存使用量采样间隔(秒)。
默认 10s。 对宿主机内存使用情况进行周期性采样的时间间隔。
说明:采样频率影响检测灵敏度与开销。
-
IntervalTracing:连续运行最小间隔(秒)。
默认 1800s(30 分钟)。 两次内存突发追踪之间的冷却时间,避免频繁执行对系统造成额外压力。
说明:防止追踪工具被过度触发。
-
DumpProcessMaxNum:触发事件时转储的最大进程数。
默认 10。 当内存突发事件触发时,最多转储多少个相关进程的详细信息(包括内存占用、调用栈等)。
说明:控制输出数据量,避免单次事件产生过多诊断信息。
7.6 内存阈值运行时快照
memory_threshold_snapshot 默认开启;将该自动追踪加入全局 BlackList
并重启 huatuo-bamai,即可关闭。
该功能在容器内存压力通知后尝试采集 Go、HotSpot 或 CPython
运行时快照,不保证在 OOM 前完成。候选进程按近似内核 OOM 分数选择。
持久化字段 victim_pid、victim_process_name 和 victim_oom_score_adj
描述本次快照选中的采集进程。
[AutoTracing.MemoryThresholdSnapshot]
# ThresholdPercent = 90
# IntervalTracing = 300
# RunTracingToolTimeout = 2
# MaxMemoryObjectEntries = 10
注释中的数值为默认值。
| 参数 |
含义 |
| ThresholdPercent |
采集要求的内存使用量与限额比例,范围 1–100 |
| IntervalTracing |
成功或失败采集尝试完成后的节点级最小间隔,单位秒,默认 300,必须为正数 |
| RunTracingToolTimeout |
Go、Java、Python 统一使用的协作式采集超时时间,单位秒,默认 2,必须为正数 |
| MaxMemoryObjectEntries |
单次快照最多保留的内存对象排序条目数,范围 1–100,默认 10;最终 JSON 上限为 512 KiB,超限会裁剪 |
运行时识别和保存时间不计入采集预算,运行时识别没有独立超时限制。
超时不能中断正在执行的同步读取,因此不是整个操作的耗时上限。
触发条件:
- cgroup v1:通过
cgroup.event_control 注册 ThresholdPercent 对应的内存阈值。
- cgroup v2:监听
memory.events.local 的 high 或 max 计数增长
(文件不存在时使用 memory.events),再检查
memory.current / memory.max 是否达到配置比例。
本功能不设置 memory.high;为 max 时仍可由硬限制的 max 计数触发检查。
该通知发生较晚,不能保证恰好在配置百分比处检测,也不能保证在 OOM 前完成抓取。
两种版本均在注册完成后和硬限制变化时检查水位。一个 watcher 管理所有目标,
不进行周期采样。同一目标的重复通知会合并,不逐次统计跨越,也不提供水位恢复通知。
抓取前会重新检查当前水位和目标身份。
该功能依赖已启用的 pod 管理器。pod 根据共享 CSS 生命周期线索主动更新容器视图,
向快照模块提供存量容器及包含实例代次、InitPID、memory cgroup 路径的增删事件。
快照模块不再扫描 cgroup 树;订阅溢出后通过 pod 的完整视图恢复。
上游同步失败时暂停采集,不能把失败视为容器全部删除。
监控范围包括运行中的普通容器和可重启 init sidecar,不包括临时调试容器及普通 init 容器。
普通注册失败或达到监听数量上限时记录日志并跳过该目录实例;监听失效后注销,不自动重试或补位。
重复事件、全量更新和容器代次变化不会恢复失败的监听。目录实例替换、原容器退出后
建立新的跟踪状态,或重启 huatuo-bamai 后可重新尝试。宿主机资源耗尽等致命错误仍会停止当前监听流程。
每个被监控容器必须拥有独立的 memory cgroup 目录;监听和采集事件直接绑定一个容器实例。
注册时若发现返回的监听已属于其他容器,则停止该功能、取消采集并释放监听;
修正容器 cgroup 隔离后需重启 huatuo-bamai,不自动重试该冲突。
目录实例替换通过 watcher 的移除通知使旧注册失效。
采集及保存前核验容器代次和实际绑定、目录身份,以及目标进程身份和
cgroup 归属。记录中的内存使用量和限额属于该容器的 cgroup。
部署限制和结果查询见第 14 节。
7.7 IRQTracing 自动追踪
该模块检测单个 CPU 的 irq+softirq 利用率异常,并调用 irqtracing 采集
softirq source 和 victim 调用栈。
[AutoTracing.IRQTracing]
Interval = 2
RunTracingToolTimeout = 3
IntervalTracing = 300
MaxEventsPerSecond = 1000
MinCPUs = 3
DeltaUsageThreshold = 20
RelativeIncreaseThreshold = 30
SustainedIntervals = 10
UsageThreshold = 80
- Interval:
/proc/stat 中每 CPU irq+softirq 利用率的采样间隔,默认 2s。
- RunTracingToolTimeout:单次
irqtracing 采集时长,默认 3s。
- IntervalTracing:两次触发之间的最小间隔,默认 300s。
- MaxEventsPerSecond:在被跟踪 CPU 上每秒采集的 source 和 victim 栈
样本总上限,默认 1000。守护进程将额度尽量均分给
softirq_raise 和
softirq_entry;默认每条流 500/s。该值必须在 2 到 8589934590 之间。
- MinCPUs、DeltaUsageThreshold 和 RelativeIncreaseThreshold:
控制多 CPU irq+softirq 利用率突增规则;两个阈值分别表示利用率增加的
百分点和相对上一采样值的增长百分比。
- SustainedIntervals 和 UsageThreshold:控制单 CPU
irq+softirq 持续高利用率规则的连续采样次数和利用率阈值。
7.8 已知问题过滤(IssuesList)
# Autotracing configuration.
#
# - IssuesList
# Known issue filters for autotracing.
#
[AutoTracing]
IssuesList = []
-
IssuesList:已知问题过滤器。格式 [["问题名称", "正则"], ...]。采集到的堆栈匹配正则时标记为对应问题名称,默认 []。当前用于 dload 追踪。
示例:IssuesList = [["known_issue1", "softlockup"], ["known_issue2", "alloc_pages.*failed"]]
注意:当前仅支持 dload 追踪的已知问题过滤,其他事件暂不支持。
8. 事件追踪配置
该 section 负责内核关键事件的捕获与延迟监控,包括调度 tick 间隔、内存回收、网络接收延迟、网卡事件及丢包监控等,是 HUATUO 内核级异常上下文采集的核心模块。
8.1 调度 tick 间隔追踪
# linux kernel events capturing configuration
[EventTracing]
# scheduler tick
#
# Trace long scheduler tick intervals.
#
# - IntervalThreshold
# When the scheduler tick interval reaches the threshold, huatuo-bamai
# will collect kernel context.
# Default: 10000000 in nanoseconds, 10ms
#
[EventTracing.SchedTick]
# IntervalThreshold = 10000000
- IntervalThreshold:调度 tick 间隔阈值(纳秒)。默认 10000000 ns(10ms)。达到该阈值时采集事件。该事件通过过长的 tick 间隔推断 CPU 异常停顿,不能单独证明软中断被禁用。
8.2 内存回收阻塞追踪
# memreclaim
#
# The memory reclaim may block the process, if one process is blocked
# for a long time, reporting the events to userspace.
#
# - BlockedThreshold
# The blocked time when memory reclaiming.
# Default: 900000000ns, 900ms
#
[EventTracing.MemoryReclaim]
# BlockedThreshold = 900000000
- BlockedThreshold:内存回收阻塞时间阈值(纳秒)。默认 900000000 ns(900ms)。 当单个进程因内存回收(reclaim)被阻塞超过该时间时,向用户态上报事件并捕获上下文。 说明:内存回收阻塞是导致进程卡顿的常见原因,尤其在内存紧张的云原生环境中。
8.3 网络接收延迟追踪
# networking rx latency
#
# linux net stack rx latency for every tcp skbs.
#
# - Driver2NetRx
# The latency from driver to net rx, e.g., netif_receive_skb.
# Default: 5ms
#
# - Driver2TCP
# The latency from driver to tcp rx, e.g., tcp_v4_rcv.
# Default: 10ms
#
# - Driver2Userspace
# The latency from driver to userspace copy data, e.g., skb_copy_datagram_iovec.
# Default: 115ms
#
# - ExcludedContainerQos
# Blacklist: skip containers whose qos level matches.
# Values: "guaranteed", "burstable", "besteffort" (case-insensitive).
# Default: [].
#
# - ExcludedHostNetnamespace
# Don't care the skbs, packets in the host net namespace.
# Default: true
#
[EventTracing.NetRxLatency]
# Driver2NetRx = 5
# Driver2TCP = 10
# Driver2Userspace = 115
# ExcludedContainerQos = []
ExcludedContainerQos = ["besteffort"]
# ExcludedHostNetnamespace = true
-
Driver2NetRx:从驱动到网络层接收的延迟阈值(毫秒)。
默认 5ms。 例如 netif_receive_skb 等函数的延迟监控阈值。
-
Driver2TCP:从驱动到 TCP 协议栈接收的延迟阈值(毫秒)。
默认 10ms。 例如 tcp_v4_rcv 等函数的延迟监控。
-
Driver2Userspace:从驱动到用户态数据拷贝的延迟阈值(毫秒)。
默认 115ms。 例如 skb_copy_datagram_iovec 等函数的延迟监控。
-
ExcludedContainerQos:排除的容器 QoS 级别,黑名单模式。
默认 [""]。 不监控指定 QoS 级别的容器网络接收延迟(对应 Kubernetes Pod QoS:Guaranteed、Burstable、BestEffort,大小写不敏感)。
说明:通常排除 BestEffort 容器以减少噪声。
-
ExcludedHostNetnamespace:是否排除宿主机网络命名空间。
默认 true。 不监控宿主机 net namespace 中的 skb 数据包延迟。
说明:聚焦容器网络流量,减少无关宿主机数据干扰。
8.4 网卡事件监控
# netdev events
#
# monitor the net device events.
#
# - DeviceList
# The net devices we take care of.
# Default: [] is empty, meaning no devices.
#
[EventTracing.Netdev]
DeviceList = ["eth0", "eth1", "bond4", "lo"]
-
DeviceList:需要监控的网卡设备完整匹配正则列表。"eth0" 等字面量名称保持精确匹配,"bond[0-9]+" 等模式可匹配多块网卡。
默认示例包含 “eth0”, “eth1”, “bond4”, “lo”。 为空列表时表示不监控任何设备。 监控网络设备的物理链路状态事件等。
说明:精确指定感兴趣的网络接口,支持 bond、lo 等。
8.5 丢包监控([EventTracing.Dropwatch])
[EventTracing.Dropwatch]
# standalone dropwatch 使用的 filter。
# 默认值:"tcp"
Filter = "tcp"
# 转发给 dropwatch --max-events-per-second。
# 默认值:100;0 表示不限速。
MaxEventsPerSecond = 100
# 预留配置字段。当前 dropwatch 事件链路未消费该字段,
# 因此不会产生容器过滤效果。
# 默认值:[]
ExcludeContainers = []
-
Filter:只传给 standalone dropwatch 的 tcpdump 风格过滤表达式。TCP 重传关联的两个输入统一使用 TCPRetransmit.Filter。
默认值:"tcp"。
-
MaxEventsPerSecond:BPF 侧每秒最多输出的 dropwatch 事件数。
默认值:100,设置为 0 表示不限速。
-
ExcludeContainers:预留的容器排除列表。
默认值:[]。该字段存在于配置结构中,但当前 dropwatch 事件链路既不读取也不转发它,因此配置后不会生效。运维侧如需按调用栈抑制 dropwatch 噪声,应使用 EventTracing.IssuesList。
8.6 TCP 重传追踪([EventTracing.TCPRetransmit])
[EventTracing.TCPRetransmit]
# 重传过滤条件;local 关联会把它应用到两个输入。
# 默认值:空(关闭关联时不传参数,开启关联时使用 "tcp")。
Filter = ""
# Forwarded as tcpshark --enable-tlp. Default: false.
EnableTLP = false
# Run tcpshark with an embedded dropwatch source. Default: false.
EnableDropwatch = false
# Forwarded as tcpshark --max-events-per-second.
# Default: 100; 0 disables rate limiting.
MaxEventsPerSecond = 100
-
EnableTLP:是否采集 tcp_send_loss_probe 事件。
默认 false。
-
Filter:两种模式都使用的 TCP 重传过滤条件。开启 local 关联后,两个 tcpshark 输入统一使用规范化后的表达式,空值回退为 tcp;关闭关联时,空值不传 --filter。Dropwatch.Filter 保持独立,只控制 standalone dropwatch。
-
EnableDropwatch:是否让 tcpshark 加载私有 dropwatch source 并在本地完成重传结果定型,默认 false。必须从 BlackList 移除 tcp_retransmit;standalone dropwatch 可以继续位于黑名单中。重传最多等待 100ms,候选 drop 的内核单调时间必须早于重传且相差不超过 1s。embedded source 自动检测并启用 devlink DROP trap。同 netns 的严格匹配按来源输出 software 或 hardware,附带与 dropwatch 一致的 drop_source、drop_reason 和硬件 drop_reason_group;每条已定型事件输出唯一的 correlation_reason(matched、unsupported、warmup、wait_timeout、queue_full 或 interrupted);warmup 仅用于等待到期且重传发生时间早于 source ready 的事件,等于或晚于 ready 的重传在等待到期时使用 wait_timeout,其他结束路径保留各自原因;未匹配事件输出 drop_location=unknown,并保留 namespace 诊断标记、dropwatch 计数及 map 计数可用性。
-
MaxEventsPerSecond:BPF 侧每秒最多输出的 TCP 重传事件数。关联模式还会给 embedded dropwatch 配置一个数值相同但独立的 limiter,因此 100 表示两条输入各自最多 100 条/秒。
默认 100,设置为 0 表示不限速。超限时 tcpshark 会输出 rate limit hit 日志。
8.7 硬件错误事件追踪(EventTracing.Ras)
# ras
#
# Hardware error event tracing (RAS: Reliability, Availability, Serviceability).
# Captures MCE, EDAC, ACPI/GHES, PCIe AER, and MCE threshold (THR) events via eBPF.
#
# - MceThrBackoff
# Minimum interval in seconds between consecutive MCE threshold (THR) event saves.
# THR events are fired by the local-APIC threshold interrupt and can storm at high
# frequency; this cooldown prevents flooding storage with redundant records.
# Default: 1800s (30 minutes)
#
[EventTracing.Ras]
# MceThrBackoff = 1800
8.8 摩尔线程 GPU 事件追踪(EventTracing.MthreadsGPU)
# mthreads_gpu
#
# Moore Threads GPU XID error event tracing.
[EventTracing.MthreadsGPU]
# MthreadsXidLevel = ""
-
MthreadsXidLevel:XID 错误报告的最低严重级别。
可选值:""(禁用)、"notify"、"warning"、"fatal"。
默认值:""(禁用)。
说明:控制哪些 XID 错误事件被报告。设置此选项以启用摩尔线程 GPU 的 XID 错误追踪。低于指定严重级别的 XID 错误将被过滤掉。要启用此功能,请确保 mthreads_xid 从全局 BlackList(如果存在)中移除,并将此字段设置为有效的严重级别之一("notify"、"warning"、"fatal")。此外,主机上必须安装 MUSA 驱动。该功能每秒轮询 /proc/driver/musa/gpu*/event_report 文件以捕获 XID 错误事件。每个 XID 事件包含详细信息,包括 UUID、XID ID、严重级别、作用域、PCI BDF、进程 ID 和附加上下文信息。
8.9 已知问题过滤(IssuesList)
# Linux kernel event tracing configuration.
#
# - IssuesList
# Known issue filters for event tracing.
#
[EventTracing]
IssuesList = []
-
IssuesList:已知问题抑制规则,格式为 [["名称", "正则"], ...],默认值为 []。
对 net_rx_latency,正则匹配生成的事件标题;对 dropwatch,正则匹配以换行符连接的内核调用栈。匹配后事件会被丢弃;配置的名称只用于标识规则,不会写入已保存事件。
示例:IssuesList = [["ignored_process", "comm=ignored_process"], ["neighbor_cleanup", "neigh_invalidate/"]]
9. 指标采集器配置
该 section 定义各类系统与网络指标的采集规则。所有 Included/Excluded 字段底层共用同一套过滤逻辑(正则表达式):
- 无规则:全部采集
- 仅 Excluded:黑名单,匹配即跳过
- 仅 Included:白名单,仅采集匹配项
- 两者并存:必须匹配 Included 且不匹配 Excluded
9.1 网卡统计
# Metric Collector
[MetricCollector]
# Netdev statistic
#
# - EnableNetlink
# Use netlink instead of procfs net/dev to get netdev statistic.
# Only support the host environment to use `netlink` now.
# Default is "false".
#
# - DeviceIncluded
# Accept special devices in netdev statistic.
# Default: "" (empty), meaning include all.
#
# - DeviceExcluded
# Exclude special devices in netdev statistic.
# Default: "" (empty), meaning exclude nothing.
#
# Filter logic see MetricCollector section header.
#
[MetricCollector.NetdevStats]
# EnableNetlink = false
# DeviceIncluded = ""
DeviceExcluded = "^(lo)|(docker\\w*)|(veth\\w*)$"
-
EnableNetlink:是否使用 netlink 而非 procfs 获取网卡统计。
默认 false。 仅宿主机环境支持 netlink。
说明:netlink 方式通常更高效,但需内核支持。
-
DeviceIncluded:需要纳入统计的网卡设备正则。默认空(全部采集)。
-
DeviceExcluded:需排除的网卡设备正则。如:排除 lo、docker、veth 等虚拟接口。
9.2 网卡 DCB(Data Center Bridging)采集
# netdev dcb, DCB (Data Center Bridging)
#
# Collecting the DCB PFC (Priority-based Flow Control).
#
# - DeviceList
# The net devices we take care of.
# Default: [] is empty, meaning no devices.
#
[MetricCollector.NetdevDCB]
DeviceList = ["eth0", "eth1"]
9.3 网卡硬件统计
# netdev hardware statistic
#
# Collecting the hardware statistic of net devices, e.g, rx_dropped.
#
# - DeviceList
# The net devices we take care of.
# Default: [] is empty, meaning no devices.
#
[MetricCollector.NetdevHW]
DeviceList = ["eth0", "eth1"]
9.4 Qdisc(队列规则)采集
# Qdisc
#
# - DeviceIncluded / DeviceExcluded
# Same as above.
#
[MetricCollector.Qdisc]
# DeviceIncluded = ""
DeviceExcluded = "^(lo)|(docker\\w*)|(veth\\w*)$"
9.5 vmstat 指标采集
# vmstat
#
# This metric supports host vmstat and cgroup vmstat.
# - IncludedOnHost / ExcludedOnHost: same filter logic, for host /proc/vmstat.
# - IncludedOnContainer / ExcludedOnContainer: same, for cgroup containers memory.stat.
#
[MetricCollector.Vmstat]
IncludedOnHost = "allocstall|nr_active_anon|nr_active_file|nr_boost_pages|nr_dirty|nr_free_pages|nr_inactive_anon|nr_inactive_file|nr_kswapd_boost|nr_mlock|nr_shmem|nr_slab_reclaimable|nr_slab_unreclaimable|nr_unevictable|nr_writeback|numa_pages_migrated|pgdeactivate|pgrefill|pgscan_direct|pgscan_kswapd|pgsteal_direct|pgsteal_kswapd"
ExcludedOnHost = "total"
IncludedOnContainer = "active_anon|active_file|dirty|inactive_anon|inactive_file|pgdeactivate|pgrefill|pgscan_direct|pgscan_kswapd|pgsteal_direct|pgsteal_kswapd|shmem|unevictable|writeback|pgscan_globaldirect|pgscan_globalkswapd|pgscan_cswapd|pgsteal_cswapd|pgsteal_globaldirect|pgsteal_globalkswapd"
ExcludedOnContainer = "total"
-
IncludedOnHost / ExcludedOnHost:宿主机 /proc/vmstat 的过滤字段正则。
-
IncludedOnContainer / ExcludedOnContainer:容器 cgroup memory.stat 的过滤字段正则。
说明:精细控制 vmstat 指标采集,支持主机与容器差异化配置,避免采集无关字段。
9.6 其他指标采集
# MemoryEvents/Netstat/MountPointStat
#
# - Included / Excluded: same as above.
# - MountPointsIncluded: whitelist only (no Excluded), same logic.
#
[MetricCollector.MemoryEvents]
Included = "watermark_inc|watermark_dec"
# Excluded = ""
[MetricCollector.Netstat]
# Excluded = ""
# Included = ""
# MountPointStat
[MetricCollector.MountPointStat]
MountPointsIncluded = "(^/home$)|(^/$)|(^/boot$)"
9.7 摩尔线程 GPU 指标
# MetricCollector.Mthreads
#
# 通过 MTML(摩尔线程管理库)共享库采集摩尔线程 GPU 指标。
# 库文件在启动时通过系统动态链接器按 SONAME 顺序自动发现
# (libmtml.so.2,然后 libmtml.so),无需硬编码路径。
#
# 从 BlackList 中移除 "mthreads_gpu" 以启用此采集器。
#
# - EnableHealth
# 启用健康指标:温度、功耗、利用率、时钟、风扇、pstate、VPU。
# 默认值:true
#
# - EnablePCIe
# 启用 PCIe 链路指标:当前速率/宽度和重放计数器。
# 默认值:false
#
# - EnableMTLink
# 启用 MtLink 互连指标:每链路状态和带宽。
# 默认值:false
#
[MetricCollector.Mthreads]
# EnableHealth = true
# EnablePCIe = false
# EnableMTLink = false
-
EnableHealth:控制健康相关指标的采集。
默认值:true。启用后采集:GPU/内存温度(gpu_temperature_celsius、memory_temperature_celsius)、功耗及限制(device_power_watts、gpu_power_limit_watts、gpu_power_default_limit_watts)、GPU/内存利用率(gpu_utilization_percent、memory_utilization_percent)、时钟频率(gpu_clock_mhz、gpu_max_clock_mhz、memory_clock_mhz、memory_max_clock_mhz)、电压(gpu_voltage_volts)、内存容量(memory_total_bytes、memory_used_bytes)、风扇转速(fan_rpm、fan_speed_percent)、性能状态(gpu_pstate)以及 VPU 指标(vpu_utilization_percent、vpu_encoder_utilization_percent、vpu_decoder_utilization_percent、vpu_clock_mhz)。
-
EnablePCIe:控制 PCIe 链路指标的采集。
默认值:false。启用后采集:当前 PCIe 链路速率和宽度(pcie_link_speed_gt_per_sec、pcie_link_width_lanes)、最大能力值(pcie_link_max_speed_gt_per_sec、pcie_link_max_width_lanes)以及重放计数器(pcie_replay_total)。
-
EnableMTLink:控制 MtLink 互连指标的采集。
默认值:false。启用后采集:设备级静态规格(每链路带宽 mtlink_link_bandwidth_gb_s 和链路数 mtlink_link_count)以及每链路状态(mtlink_state)。
库发现机制:启动时,采集器通过系统动态链接器(遵循 LD_LIBRARY_PATH 和 /etc/ld.so.cache)依次搜索 libmtml.so.2 和 libmtml.so。如果未找到库文件,采集器记录警告并在进程生命周期内保持禁用状态。库发现仅在启动时执行;更改 LD_LIBRARY_PATH 或安装新的 MTML 版本需要重启。
热更新语义:EnableHealth、EnablePCIe、EnableMTLink 在每次 scrape 时从最新配置快照中读取,因此切换这些开关后下一个 Prometheus scrape 即可生效,无需重启 huatuo-bamai。false → true → false 的转换会在每次变更后的下一个 scrape 上按预期发布或停止发布对应的指标组。
注意:在进程已经启动且因 libmtml.so 缺失导致采集器被禁用的情况下,要启用该采集器(即把 mthreads_gpu 从 BlackList 中移除)需要重启进程。采集器工厂只在初始化时运行,运行时即使库被加载成功也不会注册新的采集器。
10. Pod 配置
该 section 用于从 kubelet 获取 Pod 信息,实现容器与 Pod 级别的标签关联和指标隔离。
# Pod Configuration
#
# Configure these parameters for fetching pods from kubelet.
#
# - KubeletReadOnlyPort
# The KubeletReadOnlyPort is kubelet read-only port for the Kubelet to serve on with
# no authentication/authorization. The port number must be between 1 and 65535, inclusive.
# Setting this field to 0 disables fetching pods from kubelet read-only service.
# Default: 10255
#
# - KubeletAuthorizedPort
# The port is the HTTPs port of the kubelet. The port number must be between 1 and 65535,
# inclusive. Setting this field to 0 disables fetching pods from kubelet HTTPS port.
# Default: 10250
#
# - KubeletClientCertPath
# https://kubernetes.io/docs/setup/best-practices/certificates/
#
# Client certificate and private key file name. One file or two files:
# "/path/to/xxx-kubelet-client.crt,/path/to/xxx-kubelet-client.key",
# "/path/to/kubelet-client-current.pem"
#
# You can disable this kubelet fetching pods, for bare metal service, by
# KubeletReadOnlyPort = 0, and KubeletAuthorizedPort = 0.
#
  [Pod]
    KubeletClientCertPath = "/etc/kubernetes/pki/apiserver-kubelet-client.crt,/etc/kubernetes/pki/apiserver-kubelet-client.key"
-
KubeletReadOnlyPort:kubelet 只读端口。
默认 10255。 用于无认证方式从 kubelet 获取 Pod 列表。设置为 0 时禁用该方式。
说明:端口范围 1-65535,适合测试或非安全环境。
-
KubeletAuthorizedPort:kubelet HTTPS 授权端口。
默认 10250。 用于安全方式(证书认证)从 kubelet 获取 Pod 信息。设置为 0 时禁用。
说明:生产环境推荐使用该端口结合证书认证。
-
KubeletClientCertPath:kubelet 客户端证书及私钥路径。
支持格式:"/path/to/xxx-kubelet-client.crt,/path/to/xxx-kubelet-client.key" 或单文件 PEM 格式。
说明:参考 Kubernetes 证书最佳实践,用于 HTTPS 端口的 mTLS 认证。在裸金属或非 Kubernetes 环境中可通过将两个端口设为 0 来禁用 Pod 获取功能。
11. 命令行参数
huatuo-bamai 支持以下命令行参数:
huatuo-bamai --region <region> [选项]
| 参数 |
说明 |
默认值 |
--config |
配置文件名 |
huatuo-bamai.conf |
--config-dir |
配置文件目录 |
conf |
--bpf-dir |
BPF 对象文件目录 |
bpf |
--tools-bin-dir |
追踪工具二进制目录 |
bin |
--region |
部署区域(必填) |
- |
--disable-kubelet |
禁用 kubelet Pod 获取 |
false |
--disable-storage |
禁用存储后端 |
false |
--enable-cgroup |
启用自身 cgroup 资源限制(默认关闭) |
false |
--disable-tracing |
禁用指定追踪模块(可多次指定) |
- |
--log-debug |
强制设置日志级别为 Debug |
false |
--dry-run |
仅加载测试,启动后优雅退出 |
false |
--procfs-prefix |
procfs 挂载点前缀 |
- |
12. 配置覆盖原则
当同一配置项同时存在于命令行参数和配置文件时,遵循以下优先级:
命令行参数 > 配置文件 > 内置默认值
具体规则:
-
日志级别:--log-debug > 配置文件 [Log] Level > 内置默认值 Info
--log-debug 具有最高优先级,无论配置文件中 Level 为何值均强制设为 Debug- 配置文件中显式设置
Level 时覆盖内置默认值
- 均未设置时使用默认值
Info
-
追踪黑名单:--disable-tracing 与配置文件 BlackList 合并(两者互补,非覆盖)
-
其他布尔开关(--disable-kubelet、--disable-storage):命令行显式设置时覆盖配置文件
13. 配置最佳实践与注意事项
- 资源控制:Kubernetes 使用 Pod resources,systemd 使用 service 的资源限制。只有直接运行且没有外部管理器时,才使用
--enable-cgroup 和 [Runtime]。
- 存储选择:小规模部署可优先使用 LocalFile 进行本地排查;大规模集群推荐配置 Elasticsearch 实现集中存储与查询。
- 自动追踪调优:根据业务负载特征调整阈值,过低阈值会导致频繁触发,过高则可能遗漏问题。建议在测试环境逐步验证。
- 安全性:ES 配置中请使用强密码,并考虑启用 HTTPS;避免在配置文件中硬编码敏感信息。
- 兼容性:配置参数受内核版本、硬件环境影响,建议结合 HUATUO 官方文档验证。
通过合理配置 huatuo-bamai.conf,可充分发挥 HUATUO 在内核级异常检测与智能追踪方面的优势,有效提升云原生系统的可观测性和故障诊断效率。如需针对特定场景的深度定制,欢迎提供更多环境细节进一步讨论。
14. 内存阈值快照部署与排障
14.1 部署条件与限制
- 要求 Linux、memory cgroup v1/v2、宿主机 PID/procfs/cgroup 视图、
kubelet 元数据、内核 BTF 及加载和挂载 BPF 的权限。
- 需读取目标进程内存(通常为
CAP_SYS_PTRACE)、访问 procfs/cgroup;
v1 还需写入 cgroup.event_control。安全策略可能阻止访问。
- 仅选择该 cgroup 的直接成员,排除
oom_score_adj = -1000 的进程。
超过 4096 个 PID、64 KiB PID 数据或 1 秒预算时跳过选择。
- 最多监听 4096 个容器,目标由 pod 事件提供,不扫描 cgroup 树。
普通注册失败或容量不足时记录日志并跳过,监听失效后注销,不自动重试或补位。
同一实例不会因资源恢复或全量更新而重新注册,可能持续缺少压力监控。
- 身份校验失败或容器元数据缺失时,不采集或不保存。
- 进程选择与采集统一使用 Huatuo 所在 PID 命名空间的
/proc;
--procfs-prefix 不会重定向内存快照读取。
下表为实验性实现范围,不代表所有版本均已验证:
| 运行时 |
实验性范围 |
主要限制 |
| Go |
Go 1.18–1.26,64 位 ELF |
去符号二进制的指令恢复仅支持 x86-64 |
| Java |
Java 8+,64 位小端 ELF HotSpot,G1 GC |
依赖可识别的 VMStruct/VMType 元数据 |
| Python |
CPython 3.8–3.14,64 位小端 ELF |
需能定位 _PyRuntime 并识别版本和布局 |
已记录的人工验证:x86-64 Linux、cgroup v1(legacy/hybrid)、Go 1.24.0。
请在实际环境验证压力触发与非空快照;跳过测试或返回 unavailable 不代表兼容。
14.2 输出与排障
Info 日志记录监听状态和采集尝试。
进程选择和保存细节记录在 Debug 日志中。
按容器/cgroup 找到采集记录,通过进程选择日志确定 PID;
运行时诊断查看已保存快照的状态和原因字段。
若采集只有开始而没有结束,使用 bamai 的 /debug/pprof/goroutine?debug=2
(需相应权限)确认阻塞栈;没有日志不代表监听已停止。
tracer_data.process_memory 在运行时探测无错误返回后读取一次 /proc/<pid>/status,
也适用于 C/C++ 等未识别的运行时。provider 失败会生成 failed 快照并保留已取得的摘要。
探测或输出处理出错时不保存结果,错误原因查看采集日志;
身份变化或任务取消时丢弃结果。不提供 PSS、映射排名或分配调用栈。
| 字段(字节) |
来源 / 含义 |
virtual_bytes |
VmSize,虚拟地址空间,不是实际物理内存占用 |
rss_bytes |
VmRSS,常驻内存 |
rss_anon_bytes |
RssAnon,匿名常驻内存 |
rss_file_bytes |
RssFile,文件映射常驻内存 |
rss_shmem_bytes |
RssShmem,共享内存常驻量 |
swap_bytes |
VmSwap,私有匿名内存换出量,不含 shmem 换出 |
page_table_bytes |
VmPTE,页表内存 |
缺失或无效字段省略,不填 0;状态为 partial,完全无法读取时为
unavailable,附带 status_reason。这些近似值不是 OOM 瞬间快照,也不能直接证明泄漏;
候选进程不保证是最终 OOM victim。
结果沿用现有 [Storage] 配置,见第 6 节,无需另配存储。
LocalFile 文件名为 memory_threshold_snapshot;在 tracing_documents 中可按
tracer_name = memory_threshold_snapshot、tracer_type = autotracing 查询。
started_timestamp 记录采集尝试的开始时间,位于目标进程选择之前。
observed_timestamp 记录快照采集流程的开始时间,位于目标进程选定之后、
运行时识别之前。
tracer_data.snapshot.entries 的 kind 和统计口径如下:
| 运行时 |
kind |
objects |
bytes |
| Go |
inuse_space_objects |
根据已发布统计,按完整分配栈聚合、经采样校正的未释放对象数量估计 |
对应的未释放字节数估计 |
| Java |
object_class |
按类汇总的实例数量估计 |
对象自身占用的堆内存估计(shallow heap) |
| Python |
gc_tracked_object_type |
按类型汇总的 GC 跟踪对象数量 |
这些对象的浅层内存大小估计(shallow size) |
Go 的 bytes 和 objects 分别对应 pprof 的 inuse_space 和
inuse_objects 统计口径。Java 未计算 retained heap;Python 只覆盖 GC 跟踪对象,
不能代表整个 Python 堆。历史记录中,Go 和 Java 的 kind 可能分别为
allocation_site 和 object_type;读取历史记录的消费方应兼容这些旧值。
Go 条目的 name 保留首个非 runtime 栈帧的纯函数名;全部为 runtime 栈帧时,
取第一帧。stack 仍为字符串数组,按分配位置到上层调用者的顺序保存栈帧。
文件和行号可用时,每帧使用 函数名, 源文件:行号 格式,逗号后留一个空格。例如:
{
  "kind": "inuse_space_objects",
  "name": "example/cache.allocate",
  "bytes": 131072,
  "objects": 32,
  "average_bytes": 4096,
  "stack": [
    "example/cache.allocate, example/cache/cache.go:123",
    "example/service.load, example/service/load.go:58",
    "main.main, example/cmd/server/main.go:42"
  ]
}
位置来自二进制的 Go 行号表,无需目标机器保存源码。路径保留编译元数据中的值,
可能受 -trimpath 影响,不保证对应目标机器上的实际文件。缺少文件或有效行号时,
栈帧只显示函数名;函数也无法解析时,保留十六进制 PC。历史记录的栈帧可能只有
函数名或地址,消费方应兼容;函数名和路径本身也可能包含逗号,不能按逗号任意拆分。
源码位置用于分配归因,不表示对象持有位置,也不保证完整展开内联调用链。
Go 仅使用 runtime 已发布的 active 计数计算分配量与释放量之差,再进行采样校正,
不合并尚未发布的 future[0..2]。runtime 延迟发布以等待相应的 GC 清扫释放统计,
因此近期分配峰值可能尚未反映在结果中;结果是已发布堆画像的外部采样,
不能代表触发瞬间的堆占用。采集不获取 runtime 锁、不主动发布计数,
也不触发目标进程 GC,字段或 bucket 仍可能处于不同发布阶段,不能保证与 pprof 原子一致。
完整扫描未观察到任何非零 active 计数时,返回 unavailable,
status_reason 为 Go heap profile has no published statistics,不回退到 future。
这可能发生在尚未 GC 的进程中,并不表示没有堆对象。
已有发布计数但样本全部释放时,完整扫描仍可返回 complete 和空条目。
扫描因其他问题中断时保留 partial 及其原因,不将未扫描到数据解释为尚未发布。
Go 使用完整栈作为聚合键:Go 1.18–1.22 最多 32 帧,Go 1.23–1.26 最多 1024 帧;统一输出限制可将展示栈缩短到 64 帧,并设置 output_truncated。bucket 类型无效、栈深度超过读取上限或 bucket 链表成环时,扫描以 partial 结束,重复 bucket 不会再次累计。
扫描遇到导致 partial 的问题后停止遍历后续 bucket,保留此前及当前批次中已读取且聚合预算允许的有效样本,再按内存字节数降序排列,最多保留 MaxMemoryObjectEntries 条结果。status_reason 只记录首次原因,收尾时不追加其他原因。
任何 bucket 头、记录或栈读取失败(包括短读)都会使本次 Go 采集失败,丢弃所有运行时条目,包括此前批次的数据。采集器输出 failed 和读取错误,不逐区间重试。
栈深度为 0 的样本不生成调用栈条目,也不会因空栈被标记为 partial。
Go 快照要求采样率已知、采样已启用且 bucket 链表非空。采样率未知、采样已禁用或 bucket 链表为空时返回 unavailable,附带 status_reason,不返回条目。
Go 采集在运行时读取、扫描、排序和条目生成阶段共用一个请求超时预算。
超时后丢弃运行时条目,由采集器输出 failed 和超时原因,仍尝试读取进程内存摘要。
取消采用协作方式,正在执行的系统调用或不支持取消的解析步骤可能在截止时间之后才结束。
查看 tracer_data.snapshot.status(complete、partial、
unavailable、failed),结合 status_reason、runtime_version、
duration_ms 和 output_truncated 判断结果。
status_reason 解释采集处于 partial、unavailable 或 failed 状态的原因,
为空时省略。snapshot 和 process_memory 均使用该字段。
历史记录可能使用 reason;同时读取新旧记录的消费方应兼容两种字段名。
duration_ms 统计 provider 阶段耗时,向上取整为毫秒;成功、失败及超时快照
使用相同口径,不包含运行时探测、进程内存摘要读取、输出处理和保存时间。
| 问题 |
检查项 |
| 没有输出 |
是否启用并重启、是否被 BlackList 禁用;v2 触发条件见 7.6 |
| 有事件但没有候选进程 |
进程是否直接属于该 cgroup、是否允许 OOM kill、是否超过枚举限制 |
unavailable / failed |
运行时与布局限制、访问权限、容器元数据,以及目标是否已退出;具体见 status_reason |
| 资源耗尽后事件停止 |
检查 RLIMIT_NOFILE、fs.inotify.max_user_watches、fs.inotify.max_user_instances,调整后重启;其他事件不受此停止影响 |
5.1 - 内核全景观测
当前版本支持的指标:
CPU 系统
调度延迟
如下指标可以观测进程调度延迟状态,即一个进程从变得可运行的时刻(即被放进运行队列),到它真正开始在 CPU 上执行的这段时间。
# HELP huatuo_bamai_runqlat_container_latency cpu run queue latency for the containers
# TYPE huatuo_bamai_runqlat_container_latency gauge
huatuo_bamai_runqlat_container_latency{container_host="coredns-855c4dd65d-8v5kg",container_hostnamespace="kube-system",container_level="burstable",container_name="coredns",container_type="normal",host="hostname",region="dev",zone="0"} 226
huatuo_bamai_runqlat_container_latency{container_host="coredns-855c4dd65d-8v5kg",container_hostnamespace="kube-system",container_level="burstable",container_name="coredns",container_type="normal",host="hostname",region="dev",zone="1"} 0
huatuo_bamai_runqlat_container_latency{container_host="coredns-855c4dd65d-8v5kg",container_hostnamespace="kube-system",container_level="burstable",container_name="coredns",container_type="normal",host="hostname",region="dev",zone="2"} 0
huatuo_bamai_runqlat_container_latency{container_host="coredns-855c4dd65d-8v5kg",container_hostnamespace="kube-system",container_level="burstable",container_name="coredns",container_type="normal",host="hostname",region="dev",zone="3"} 0

# HELP huatuo_bamai_runqlat_latency cpu run queue latency for the host
# TYPE huatuo_bamai_runqlat_latency gauge
huatuo_bamai_runqlat_latency{host="hostname",region="dev",zone="0"} 35100
huatuo_bamai_runqlat_latency{host="hostname",region="dev",zone="1"} 0
huatuo_bamai_runqlat_latency{host="hostname",region="dev",zone="2"} 0
huatuo_bamai_runqlat_latency{host="hostname",region="dev",zone="3"} 0
| 指标 |
意义 |
单位 |
对象 |
取值 |
标签 |
| runqlat_container_latency |
进程调度延迟计数:
zone0, 0~10ms
zone1, 10-20ms
zone2, 20-50ms
zone3, 50+ms |
计数 |
容器 |
eBPF |
container_host, container_hostnamespace, container_level, container_name, container_type, host, region, zone |
| runqlat_latency |
进程调度延迟计数:
zone0, 0~10ms
zone1, 10-20ms
zone2, 20-50ms
zone3, 50+ms |
计数 |
物理机 |
eBPF |
host, region, zone |
中断延迟
系统中各类软中断在不同CPU上的响应延迟指标(当前只采集了 NET_RX/NET_TX)。
# HELP huatuo_bamai_softirq_latency softirq latency
# TYPE huatuo_bamai_softirq_latency gauge
huatuo_bamai_softirq_latency{cpuid="0",host="hostname",region="dev",type="NET_RX",zone="0"} 125
huatuo_bamai_softirq_latency{cpuid="0",host="hostname",region="dev",type="NET_RX",zone="1"} 2
huatuo_bamai_softirq_latency{cpuid="0",host="hostname",region="dev",type="NET_RX",zone="2"} 0
huatuo_bamai_softirq_latency{cpuid="0",host="hostname",region="dev",type="NET_RX",zone="3"} 0
huatuo_bamai_softirq_latency{cpuid="0",host="hostname",region="dev",type="NET_TX",zone="0"} 0
huatuo_bamai_softirq_latency{cpuid="0",host="hostname",region="dev",type="NET_TX",zone="1"} 0
huatuo_bamai_softirq_latency{cpuid="0",host="hostname",region="dev",type="NET_TX",zone="2"} 0
huatuo_bamai_softirq_latency{cpuid="0",host="hostname",region="dev",type="NET_TX",zone="3"} 0
huatuo_bamai_softirq_latency{cpuid="1",host="hostname",region="dev",type="NET_RX",zone="0"} 110
huatuo_bamai_softirq_latency{cpuid="1",host="hostname",region="dev",type="NET_RX",zone="1"} 0
huatuo_bamai_softirq_latency{cpuid="1",host="hostname",region="dev",type="NET_RX",zone="2"} 1
huatuo_bamai_softirq_latency{cpuid="1",host="hostname",region="dev",type="NET_RX",zone="3"} 0
huatuo_bamai_softirq_latency{cpuid="1",host="hostname",region="dev",type="NET_TX",zone="0"} 0
huatuo_bamai_softirq_latency{cpuid="1",host="hostname",region="dev",type="NET_TX",zone="1"} 0
huatuo_bamai_softirq_latency{cpuid="1",host="hostname",region="dev",type="NET_TX",zone="2"} 0
| 指标 |
意义 |
单位 |
对象 |
取值 |
标签 |
| softirq_latency |
软中断响应延迟在不同 zone 的计数:
zone0, 0-10us
zone1, 10-100us
zone2, 100-1000us
zone3, 1+ms |
计数 |
物理机 |
eBPF |
cpuid, host, region, type, zone |
资源利用率
通过如下指标可以观测,物理机,容器的 CPU 资源使用情况,prometheus 指标格式:
# HELP huatuo_bamai_cpu_util_sys cpu sys for the host
# TYPE huatuo_bamai_cpu_util_sys gauge
huatuo_bamai_cpu_util_sys{host="hostname",region="dev"} 6.268857848549965e-06
# HELP huatuo_bamai_cpu_util_total cpu total for the host
# TYPE huatuo_bamai_cpu_util_total gauge
huatuo_bamai_cpu_util_total{host="hostname",region="dev"} 1.7736934944144352e-05
# HELP huatuo_bamai_cpu_util_usr cpu usr for the host
# TYPE huatuo_bamai_cpu_util_usr gauge
huatuo_bamai_cpu_util_usr{host="hostname",region="dev"} 1.1468077095594387e-05

# HELP huatuo_bamai_cpu_util_container_sys cpu sys for the containers
# TYPE huatuo_bamai_cpu_util_container_sys gauge
huatuo_bamai_cpu_util_container_sys{container_host="coredns-855c4dd65d-8v5kg",container_hostnamespace="kube-system",container_level="burstable",container_name="coredns",container_type="normal",host="hostname",region="dev"} 1.6708593420881415e-07
# HELP huatuo_bamai_cpu_util_container_total cpu total for the containers
# TYPE huatuo_bamai_cpu_util_container_total gauge
huatuo_bamai_cpu_util_container_total{container_host="coredns-855c4dd65d-8v5kg",container_hostnamespace="kube-system",container_level="burstable",container_name="coredns",container_type="normal",host="hostname",region="dev"} 3.379584661890774e-07
# HELP huatuo_bamai_cpu_util_container_usr cpu usr for the containers
# TYPE huatuo_bamai_cpu_util_container_usr gauge
huatuo_bamai_cpu_util_container_usr{container_host="coredns-855c4dd65d-8v5kg",container_hostnamespace="kube-system",container_level="burstable",container_name="coredns",container_type="normal",host="hostname",region="dev"} 1.7087253017325962e-07
| 指标 |
意义 |
单位 |
对象 |
标签 |
| cpu_util_sys |
CPU 内核态利用率 |
% |
物理机 |
host, region |
| cpu_util_usr |
CPU 用户态利用率 |
% |
物理机 |
host, region |
| cpu_util_total |
CPU 总利用率 |
% |
物理机 |
host, region |
| cpu_util_container_sys |
CPU 内核态利用率 |
% |
容器 |
container_host,container_hostnamespace,container_level,container_name,container_type,host,region |
| cpu_util_container_usr |
CPU 用户态利用率 |
% |
容器 |
container_host,container_hostnamespace,container_level,container_name,container_type,host,region |
| cpu_util_container_total |
CPU 总利用率 |
% |
容器 |
container_host,container_hostnamespace,container_level,container_name,container_type,host,region |
资源配置
通过如下指标可以了解容器 CPU 资源配置情况,prometheus 指标格式:
# HELP huatuo_bamai_cpu_util_container_cores cpu core number for the containers
# TYPE huatuo_bamai_cpu_util_container_cores gauge
huatuo_bamai_cpu_util_container_cores{container_host="coredns-855c4dd65d-8v5kg",container_hostnamespace="kube-system",container_level="Burstable",container_name="coredns",container_type="Normal",host="hostname",region="dev"} 6
| 指标 |
意义 |
单位 |
对象 |
标签 |
| cpu_util_container_cores |
CPU 核心数 |
个 |
容器 |
container_host, container_hostnamespace, container_level, container_name, container_type, host, region |
资源争抢
这些指标体现了容器争抢,被限制等状态,prometheus 指标格式:
# HELP huatuo_bamai_cpu_stat_container_nr_throttled throttle nr for the containers
# TYPE huatuo_bamai_cpu_stat_container_nr_throttled gauge
huatuo_bamai_cpu_stat_container_nr_throttled{container_host="coredns-855c4dd65d-8v5kg",container_hostnamespace="kube-system",container_level="burstable",container_name="coredns",container_type="normal",host="hostname",region="dev"} 0
# HELP huatuo_bamai_cpu_stat_container_throttled_time throttle time for the containers
# TYPE huatuo_bamai_cpu_stat_container_throttled_time gauge
huatuo_bamai_cpu_stat_container_throttled_time{container_host="coredns-855c4dd65d-8v5kg",container_hostnamespace="kube-system",container_level="burstable",container_name="coredns",container_type="normal",host="hostname",region="dev"} 0
| 指标 |
意义 |
单位 |
对象 |
标签 |
| cpu_stat_container_nr_throttled |
当前 cgroup 被 throttled 限制的次数 |
计数 |
容器 |
container_host, container_hostnamespace, container_level, container_name, container_type, host, region |
| cpu_stat_container_throttled_time |
当前 cgroup 被 throttled 限制的总时间 |
纳秒 |
容器 |
container_host, container_hostnamespace, container_level, container_name, container_type, host, region |
Ref:
内核导出 wait_sum 时提供以下争抢指标:
# HELP huatuo_bamai_cpu_stat_container_wait_sum_percent percentage of CFS cgroup schedulable time spent waiting on the parent runqueue (requires kernel.sched_schedstats=1)
# TYPE huatuo_bamai_cpu_stat_container_wait_sum_percent gauge
huatuo_bamai_cpu_stat_container_wait_sum_percent{container_host="coredns-855c4dd65d-8v5kg",container_hostnamespace="kube-system",container_level="burstable",container_name="coredns",container_type="normal",host="hostname",region="dev"} 0
资源突发
如下指标体现了容器出现资源突发使用状态:
# HELP huatuo_bamai_cpu_stat_container_nr_bursts burst nr for the containers
# TYPE huatuo_bamai_cpu_stat_container_nr_bursts gauge
huatuo_bamai_cpu_stat_container_nr_bursts{container_host="coredns-855c4dd65d-8v5kg",container_hostnamespace="kube-system",container_level="burstable",container_name="coredns",container_type="normal",host="hostname",region="dev"} 0
# HELP huatuo_bamai_cpu_stat_container_burst_time burst time for the containers
# TYPE huatuo_bamai_cpu_stat_container_burst_time gauge
huatuo_bamai_cpu_stat_container_burst_time{container_host="coredns-855c4dd65d-8v5kg",container_hostnamespace="kube-system",container_level="burstable",container_name="coredns",container_type="normal",host="hostname",region="dev"} 0
| 指标 |
意义 |
单位 |
对象 |
标签 |
| cpu_stat_container_burst_time |
所有在各个周期中超过 quota 部分所累计使用的真实墙钟时间 |
纳秒 |
容器 |
container_host, container_hostnamespace, container_level, container_name, container_type, host, region |
| cpu_stat_container_nr_bursts |
发生超额使用的周期数量 |
计数 |
容器 |
container_host, container_hostnamespace, container_level, container_name, container_type, host, region |
资源负载
这些指标体现物理机、容器负载状态。
# HELP huatuo_bamai_loadavg_load1 system load average, 1 minute
# TYPE huatuo_bamai_loadavg_load1 gauge
huatuo_bamai_loadavg_load1{host="hostname",region="dev"} 0.3
# HELP huatuo_bamai_loadavg_load15 system load average, 15 minutes
# TYPE huatuo_bamai_loadavg_load15 gauge
huatuo_bamai_loadavg_load15{host="hostname",region="dev"} 0.22
# HELP huatuo_bamai_loadavg_load5 system load average, 5 minutes
# TYPE huatuo_bamai_loadavg_load5 gauge
huatuo_bamai_loadavg_load5{host="hostname",region="dev"} 0.2
# HELP huatuo_bamai_loadavg_container_nr_running nr_running of container
# TYPE huatuo_bamai_loadavg_container_nr_running gauge
huatuo_bamai_loadavg_container_nr_running{container_host="coredns-855c4dd65d-8v5kg",container_hostnamespace="kube-system",container_level="burstable",container_name="coredns",container_type="normal",host="hostname",region="dev"} 1
# HELP huatuo_bamai_loadavg_container_nr_uninterruptible nr_uninterruptible of container
# TYPE huatuo_bamai_loadavg_container_nr_uninterruptible gauge
huatuo_bamai_loadavg_container_nr_uninterruptible{container_host="coredns-855c4dd65d-8v5kg",container_hostnamespace="kube-system",container_level="burstable",container_name="coredns",container_type="normal",host="hostname",region="dev"} 0
| 指标 |
意义 |
单位 |
对象 |
标签 |
备注 |
| loadavg_load1 |
系统过去 1 分钟的平均负载 |
计数 |
物理机 |
host, region |
|
| loadavg_load5 |
系统过去 5 分钟的平均负载 |
计数 |
物理机 |
host, region |
|
| loadavg_load15 |
系统过去 15 分钟的平均负载 |
计数 |
物理机 |
host, region |
|
| loadavg_container_container_nr_running |
容器中运行的任务数量 |
计数 |
容器 |
host, region |
只支持 cgroup v1 |
| loadavg_container_container_nr_uninterruptible |
容器中不可中断任务的数量 |
计数 |
容器 |
host, region |
只支持 cgroup v1 |
内存系统
资源回收
系统内存回收行为可能导致进程被阻塞。通过这些指标可以了解系统内存状态。
# HELP huatuo_bamai_memory_free_allocpages_stall time stalled in alloc pages
# TYPE huatuo_bamai_memory_free_allocpages_stall gauge
huatuo_bamai_memory_free_allocpages_stall{host="hostname",region="dev"} 0
# HELP huatuo_bamai_memory_free_compaction_stall time stalled in memory compaction
# TYPE huatuo_bamai_memory_free_compaction_stall gauge
huatuo_bamai_memory_free_compaction_stall{host="hostname",region="dev"} 0
# HELP huatuo_bamai_memory_reclaim_container_directstall counter of cgroup reclaim when try_charge
# TYPE huatuo_bamai_memory_reclaim_container_directstall gauge
huatuo_bamai_memory_reclaim_container_directstall{container_host="coredns-855c4dd65d-8v5kg",container_hostnamespace="kube-system",container_level="burstable",container_name="coredns",container_type="normal",host="hostname",region="dev"} 0
| 指标 |
意义 |
单位 |
对象 |
取值 |
标签 |
| memory_free_allocpages_stall |
系统在分配内存页过程中的耗时计数 |
纳秒 |
物理机 |
eBPF |
host, region |
| memory_free_compaction_stall |
系统在规整内存页过程中的耗时计数 |
纳秒 |
物理机 |
eBPF |
host, region |
| memory_reclaim_container_directstall |
容器直接内存事件次数 |
计数 |
容器 |
eBPF |
container_host, container_hostnamespace, container_level, container_name, container_type, host, region |
注意:memory_others_container_directstall_time、memory_others_container_asyncreclaim_time、memory_others_container_local_direct_reclaim_time 指标读取的是滴滴云定制内核提供的 memory cgroup 扩展接口(memory.directstall_stat、memory.asynreclaim_stat、memory.local_direct_reclaim_time)。主线内核及常见发行版内核不提供这些接口,因此这些指标不会输出,属预期行为,无需额外加载内核模块。在标准内核上观测容器直接回收(direct reclaim)行为,请使用上表基于 eBPF 实现的 memory_reclaim_container_directstall。
资源状态
通过如下指标可以了解整体系统、容器的内存状态。
# HELP huatuo_bamai_memory_vmstat_container_active_anon cgroup memory.stat active_anon
# TYPE huatuo_bamai_memory_vmstat_container_active_anon gauge
huatuo_bamai_memory_vmstat_container_active_anon{container_host="coredns-855c4dd65d-8v5kg",container_hostnamespace="kube-system",container_level="burstable",container_name="coredns",container_type="normal",host="hostname",region="dev"} 1.47456e+07
# HELP huatuo_bamai_memory_vmstat_container_active_file cgroup memory.stat active_file
# TYPE huatuo_bamai_memory_vmstat_container_active_file gauge
huatuo_bamai_memory_vmstat_container_active_file{container_host="coredns-855c4dd65d-8v5kg",container_hostnamespace="kube-system",container_level="burstable",container_name="coredns",container_type="normal",host="hostname",region="dev"} 2.3617536e+07
# HELP huatuo_bamai_memory_vmstat_container_file_dirty cgroup memory.stat file_dirty
# TYPE huatuo_bamai_memory_vmstat_container_file_dirty gauge
huatuo_bamai_memory_vmstat_container_file_dirty{container_host="coredns-855c4dd65d-8v5kg",container_hostnamespace="kube-system",container_level="burstable",container_name="coredns",container_type="normal",host="hostname",region="dev"} 0
# HELP huatuo_bamai_memory_vmstat_container_file_writeback cgroup memory.stat file_writeback
# TYPE huatuo_bamai_memory_vmstat_container_file_writeback gauge
huatuo_bamai_memory_vmstat_container_file_writeback{container_host="coredns-855c4dd65d-8v5kg",container_hostnamespace="kube-system",container_level="burstable",container_name="coredns",container_type="normal",host="hostname",region="dev"} 0
# HELP huatuo_bamai_memory_vmstat_container_inactive_anon cgroup memory.stat inactive_anon
# TYPE huatuo_bamai_memory_vmstat_container_inactive_anon gauge
huatuo_bamai_memory_vmstat_container_inactive_anon{container_host="coredns-855c4dd65d-8v5kg",container_hostnamespace="kube-system",container_level="burstable",container_name="coredns",container_type="normal",host="hostname",region="dev"} 0
# HELP huatuo_bamai_memory_vmstat_container_inactive_file cgroup memory.stat inactive_file
# TYPE huatuo_bamai_memory_vmstat_container_inactive_file gauge
huatuo_bamai_memory_vmstat_container_inactive_file{container_host="coredns-855c4dd65d-8v5kg",container_hostnamespace="kube-system",container_level="burstable",container_name="coredns",container_type="normal",host="hostname",region="dev"} 65536
# HELP huatuo_bamai_memory_vmstat_container_pgdeactivate cgroup memory.stat pgdeactivate
# TYPE huatuo_bamai_memory_vmstat_container_pgdeactivate gauge
huatuo_bamai_memory_vmstat_container_pgdeactivate{container_host="coredns-855c4dd65d-8v5kg",container_hostnamespace="kube-system",container_level="burstable",container_name="coredns",container_type="normal",host="hostname",region="dev"} 0
# HELP huatuo_bamai_memory_vmstat_container_pgrefill cgroup memory.stat pgrefill
# TYPE huatuo_bamai_memory_vmstat_container_pgrefill gauge
huatuo_bamai_memory_vmstat_container_pgrefill{container_host="coredns-855c4dd65d-8v5kg",container_hostnamespace="kube-system",container_level="burstable",container_name="coredns",container_type="normal",host="hostname",region="dev"} 0
# HELP huatuo_bamai_memory_vmstat_container_pgscan_direct cgroup memory.stat pgscan_direct
# TYPE huatuo_bamai_memory_vmstat_container_pgscan_direct gauge
huatuo_bamai_memory_vmstat_container_pgscan_direct{container_host="coredns-855c4dd65d-8v5kg",container_hostnamespace="kube-system",container_level="burstable",container_name="coredns",container_type="normal",host="hostname",region="dev"} 0
# HELP huatuo_bamai_memory_vmstat_container_pgscan_kswapd cgroup memory.stat pgscan_kswapd
# TYPE huatuo_bamai_memory_vmstat_container_pgscan_kswapd gauge
huatuo_bamai_memory_vmstat_container_pgscan_kswapd{container_host="coredns-855c4dd65d-8v5kg",container_hostnamespace="kube-system",container_level="burstable",container_name="coredns",container_type="normal",host="hostname",region="dev"} 0
# HELP huatuo_bamai_memory_vmstat_container_pgsteal_direct cgroup memory.stat pgsteal_direct
# TYPE huatuo_bamai_memory_vmstat_container_pgsteal_direct gauge
huatuo_bamai_memory_vmstat_container_pgsteal_direct{container_host="coredns-855c4dd65d-8v5kg",container_hostnamespace="kube-system",container_level="burstable",container_name="coredns",container_type="normal",host="hostname",region="dev"} 0
# HELP huatuo_bamai_memory_vmstat_container_pgsteal_kswapd cgroup memory.stat pgsteal_kswapd
# TYPE huatuo_bamai_memory_vmstat_container_pgsteal_kswapd gauge
huatuo_bamai_memory_vmstat_container_pgsteal_kswapd{container_host="coredns-855c4dd65d-8v5kg",container_hostnamespace="kube-system",container_level="burstable",container_name="coredns",container_type="normal",host="hostname",region="dev"} 0
# HELP huatuo_bamai_memory_vmstat_container_shmem cgroup memory.stat shmem
# TYPE huatuo_bamai_memory_vmstat_container_shmem gauge
huatuo_bamai_memory_vmstat_container_shmem{container_host="coredns-855c4dd65d-8v5kg",container_hostnamespace="kube-system",container_level="burstable",container_name="coredns",container_type="normal",host="hostname",region="dev"} 0
# HELP huatuo_bamai_memory_vmstat_container_shmem_thp cgroup memory.stat shmem_thp
# TYPE huatuo_bamai_memory_vmstat_container_shmem_thp gauge
huatuo_bamai_memory_vmstat_container_shmem_thp{container_host="coredns-855c4dd65d-8v5kg",container_hostnamespace="kube-system",container_level="burstable",container_name="coredns",container_type="normal",host="hostname",region="dev"} 0
# HELP huatuo_bamai_memory_vmstat_container_unevictable cgroup memory.stat unevictable
# TYPE huatuo_bamai_memory_vmstat_container_unevictable gauge
huatuo_bamai_memory_vmstat_container_unevictable{container_host="coredns-855c4dd65d-8v5kg",container_hostnamespace="kube-system",container_level="burstable",container_name="coredns",container_type="normal",host="hostname",region="dev"} 0
| 指标 |
意义 |
单位 |
对象 |
标签 |
| memory_vmstat_container_active_file |
活跃的文件内存数 |
字节, Bytes |
容器 |
container_host, container_hostnamespace, container_level, container_name, container_type, host, region |
| memory_vmstat_container_active_anon |
活跃的匿名内存数 |
字节, Bytes |
容器 |
container_host, container_hostnamespace, container_level, container_name, container_type, host, region |
| memory_vmstat_container_inactive_file |
非活跃的文件内存数 |
字节, Bytes |
容器 |
container_host, container_hostnamespace, container_level, container_name, container_type, host, region |
| memory_vmstat_container_inactive_anon |
非活跃的匿名内存数 |
字节, Bytes |
容器 |
container_host, container_hostnamespace, container_level, container_name, container_type, host, region |
| memory_vmstat_container_file_dirty |
已修改且还未写入磁盘的文件内存大小 |
字节, Bytes |
容器 |
container_host, container_hostnamespace, container_level, container_name, container_type, host, region |
| memory_vmstat_container_file_writeback |
已修改且正等待写入磁盘的文件内存大小 |
字节, Bytes |
容器 |
container_host, container_hostnamespace, container_level, container_name, container_type, host, region |
| memory_vmstat_container_dirty |
已修改且还未写入磁盘的内存大小 |
字节, Bytes |
容器 |
container_host, container_hostnamespace, container_level, container_name, container_type, host, region |
| memory_vmstat_container_writeback |
已修改且正等待写入磁盘的文件,匿名内存大小 |
字节, Bytes |
容器 |
container_host, container_hostnamespace, container_level, container_name, container_type, host, region |
| memory_vmstat_container_pgdeactivate |
将页面从 active LRU 移动到 inactive LRU 的数量 |
页数 |
容器 |
container_host, container_hostnamespace, container_level, container_name, container_type, host, region |
| memory_vmstat_container_pgrefill |
在 active LRU 链表上被扫描的页面总数 |
页数 |
容器 |
container_host, container_hostnamespace, container_level, container_name, container_type, host, region |
| memory_vmstat_container_pgscan_direct |
直接回收时,在 inactive LRU 上扫描过的页面总数 |
页数 |
容器 |
container_host, container_hostnamespace, container_level, container_name, container_type, host, region |
| memory_vmstat_container_pgscan_kswapd |
kswapd 在 inactive LRU 链表上扫描过的页面总数 |
页数 |
容器 |
container_host, container_hostnamespace, container_level, container_name, container_type, host, region |
| memory_vmstat_container_pgsteal_direct |
直接回收时,成功从 inactive LRU 回收的页面总数 |
页数 |
容器 |
container_host, container_hostnamespace, container_level, container_name, container_type, host, region |
| memory_vmstat_container_pgsteal_kswapd |
kswapd 成功从 inactive LRU 回收的页面总数 |
页数 |
容器 |
container_host, container_hostnamespace, container_level, container_name, container_type, host, region |
| memory_vmstat_container_unevictable |
不可回收的页面字节数 |
字节, Bytes |
容器 |
container_host, container_hostnamespace, container_level, container_name, container_type, host, region |
物理机内存资源指标:
# HELP huatuo_bamai_memory_vmstat_allocstall_device /proc/vmstat allocstall_device
# TYPE huatuo_bamai_memory_vmstat_allocstall_device gauge
huatuo_bamai_memory_vmstat_allocstall_device{host="hostname",region="dev"} 0
# HELP huatuo_bamai_memory_vmstat_allocstall_dma /proc/vmstat allocstall_dma
# TYPE huatuo_bamai_memory_vmstat_allocstall_dma gauge
huatuo_bamai_memory_vmstat_allocstall_dma{host="hostname",region="dev"} 0
# HELP huatuo_bamai_memory_vmstat_allocstall_dma32 /proc/vmstat allocstall_dma32
# TYPE huatuo_bamai_memory_vmstat_allocstall_dma32 gauge
huatuo_bamai_memory_vmstat_allocstall_dma32{host="hostname",region="dev"} 0
# HELP huatuo_bamai_memory_vmstat_allocstall_movable /proc/vmstat allocstall_movable
# TYPE huatuo_bamai_memory_vmstat_allocstall_movable gauge
huatuo_bamai_memory_vmstat_allocstall_movable{host="hostname",region="dev"} 0
# HELP huatuo_bamai_memory_vmstat_allocstall_normal /proc/vmstat allocstall_normal
# TYPE huatuo_bamai_memory_vmstat_allocstall_normal gauge
huatuo_bamai_memory_vmstat_allocstall_normal{host="hostname",region="dev"} 0
# HELP huatuo_bamai_memory_vmstat_nr_active_anon /proc/vmstat nr_active_anon
# TYPE huatuo_bamai_memory_vmstat_nr_active_anon gauge
huatuo_bamai_memory_vmstat_nr_active_anon{host="hostname",region="dev"} 155449
# HELP huatuo_bamai_memory_vmstat_nr_active_file /proc/vmstat nr_active_file
# TYPE huatuo_bamai_memory_vmstat_nr_active_file gauge
huatuo_bamai_memory_vmstat_nr_active_file{host="hostname",region="dev"} 212425
# HELP huatuo_bamai_memory_vmstat_nr_dirty /proc/vmstat nr_dirty
# TYPE huatuo_bamai_memory_vmstat_nr_dirty gauge
huatuo_bamai_memory_vmstat_nr_dirty{host="hostname",region="dev"} 19047
# HELP huatuo_bamai_memory_vmstat_nr_dirty_background_threshold /proc/vmstat nr_dirty_background_threshold
# TYPE huatuo_bamai_memory_vmstat_nr_dirty_background_threshold gauge
huatuo_bamai_memory_vmstat_nr_dirty_background_threshold{host="hostname",region="dev"} 379858
# HELP huatuo_bamai_memory_vmstat_nr_dirty_threshold /proc/vmstat nr_dirty_threshold
# TYPE huatuo_bamai_memory_vmstat_nr_dirty_threshold gauge
huatuo_bamai_memory_vmstat_nr_dirty_threshold{host="hostname",region="dev"} 760646
# HELP huatuo_bamai_memory_vmstat_nr_free_pages /proc/vmstat nr_free_pages
# TYPE huatuo_bamai_memory_vmstat_nr_free_pages gauge
huatuo_bamai_memory_vmstat_nr_free_pages{host="hostname",region="dev"} 3.20535e+06
# HELP huatuo_bamai_memory_vmstat_nr_inactive_anon /proc/vmstat nr_inactive_anon
# TYPE huatuo_bamai_memory_vmstat_nr_inactive_anon gauge
huatuo_bamai_memory_vmstat_nr_inactive_anon{host="hostname",region="dev"} 0
# HELP huatuo_bamai_memory_vmstat_nr_inactive_file /proc/vmstat nr_inactive_file
# TYPE huatuo_bamai_memory_vmstat_nr_inactive_file gauge
huatuo_bamai_memory_vmstat_nr_inactive_file{host="hostname",region="dev"} 428518
# HELP huatuo_bamai_memory_vmstat_nr_mlock /proc/vmstat nr_mlock
# TYPE huatuo_bamai_memory_vmstat_nr_mlock gauge
huatuo_bamai_memory_vmstat_nr_mlock{host="hostname",region="dev"} 6821
# HELP huatuo_bamai_memory_vmstat_nr_shmem /proc/vmstat nr_shmem
# TYPE huatuo_bamai_memory_vmstat_nr_shmem gauge
huatuo_bamai_memory_vmstat_nr_shmem{host="hostname",region="dev"} 541
# HELP huatuo_bamai_memory_vmstat_nr_shmem_hugepages /proc/vmstat nr_shmem_hugepages
# TYPE huatuo_bamai_memory_vmstat_nr_shmem_hugepages gauge
huatuo_bamai_memory_vmstat_nr_shmem_hugepages{host="hostname",region="dev"} 0
# HELP huatuo_bamai_memory_vmstat_nr_shmem_pmdmapped /proc/vmstat nr_shmem_pmdmapped
# TYPE huatuo_bamai_memory_vmstat_nr_shmem_pmdmapped gauge
huatuo_bamai_memory_vmstat_nr_shmem_pmdmapped{host="hostname",region="dev"} 0
# HELP huatuo_bamai_memory_vmstat_nr_slab_reclaimable /proc/vmstat nr_slab_reclaimable
# TYPE huatuo_bamai_memory_vmstat_nr_slab_reclaimable gauge
huatuo_bamai_memory_vmstat_nr_slab_reclaimable{host="hostname",region="dev"} 22322
# HELP huatuo_bamai_memory_vmstat_nr_slab_unreclaimable /proc/vmstat nr_slab_unreclaimable
# TYPE huatuo_bamai_memory_vmstat_nr_slab_unreclaimable gauge
huatuo_bamai_memory_vmstat_nr_slab_unreclaimable{host="hostname",region="dev"} 24168
# HELP huatuo_bamai_memory_vmstat_nr_unevictable /proc/vmstat nr_unevictable
# TYPE huatuo_bamai_memory_vmstat_nr_unevictable gauge
huatuo_bamai_memory_vmstat_nr_unevictable{host="hostname",region="dev"} 6839
# HELP huatuo_bamai_memory_vmstat_nr_writeback /proc/vmstat nr_writeback
# TYPE huatuo_bamai_memory_vmstat_nr_writeback gauge
huatuo_bamai_memory_vmstat_nr_writeback{host="hostname",region="dev"} 0
# HELP huatuo_bamai_memory_vmstat_nr_writeback_temp /proc/vmstat nr_writeback_temp
# TYPE huatuo_bamai_memory_vmstat_nr_writeback_temp gauge
huatuo_bamai_memory_vmstat_nr_writeback_temp{host="hostname",region="dev"} 0
# HELP huatuo_bamai_memory_vmstat_numa_pages_migrated /proc/vmstat numa_pages_migrated
# TYPE huatuo_bamai_memory_vmstat_numa_pages_migrated gauge
huatuo_bamai_memory_vmstat_numa_pages_migrated{host="hostname",region="dev"} 0
# HELP huatuo_bamai_memory_vmstat_pgdeactivate /proc/vmstat pgdeactivate
# TYPE huatuo_bamai_memory_vmstat_pgdeactivate gauge
huatuo_bamai_memory_vmstat_pgdeactivate{host="hostname",region="dev"} 0
# HELP huatuo_bamai_memory_vmstat_pgrefill /proc/vmstat pgrefill
# TYPE huatuo_bamai_memory_vmstat_pgrefill gauge
huatuo_bamai_memory_vmstat_pgrefill{host="hostname",region="dev"} 0
# HELP huatuo_bamai_memory_vmstat_pgscan_direct /proc/vmstat pgscan_direct
# TYPE huatuo_bamai_memory_vmstat_pgscan_direct gauge
huatuo_bamai_memory_vmstat_pgscan_direct{host="hostname",region="dev"} 0
# HELP huatuo_bamai_memory_vmstat_pgscan_direct_throttle /proc/vmstat pgscan_direct_throttle
# TYPE huatuo_bamai_memory_vmstat_pgscan_direct_throttle gauge
huatuo_bamai_memory_vmstat_pgscan_direct_throttle{host="hostname",region="dev"} 0
# HELP huatuo_bamai_memory_vmstat_pgscan_kswapd /proc/vmstat pgscan_kswapd
# TYPE huatuo_bamai_memory_vmstat_pgscan_kswapd gauge
huatuo_bamai_memory_vmstat_pgscan_kswapd{host="hostname",region="dev"} 0
# HELP huatuo_bamai_memory_vmstat_pgsteal_direct /proc/vmstat pgsteal_direct
# TYPE huatuo_bamai_memory_vmstat_pgsteal_direct gauge
huatuo_bamai_memory_vmstat_pgsteal_direct{host="hostname",region="dev"} 0
# HELP huatuo_bamai_memory_vmstat_pgsteal_kswapd /proc/vmstat pgsteal_kswapd
# TYPE huatuo_bamai_memory_vmstat_pgsteal_kswapd gauge
huatuo_bamai_memory_vmstat_pgsteal_kswapd{host="hostname",region="dev"} 0
- 页面状态与 LRU 分布, Page state & LRU
| 指标 |
意义 |
单位 |
对象 |
标签 |
| nr_free_pages |
空闲页面总数(伙伴系统可直接分配)。 |
页面 |
物理机 |
host, region |
| nr_inactive_anon |
非活跃匿名页面数 |
页面 |
物理机 |
host, region |
| nr_inactive_file |
活跃文件页面数 |
页面 |
物理机 |
host, region |
| nr_active_anon |
活跃匿名页面数 |
页面 |
物理机 |
host, region |
| nr_active_file |
活跃文件页面数 |
页面 |
物理机 |
host, region |
| nr_unevictable |
不可回收页面数(mlocked、hugetlbfs 等) |
页面 |
物理机 |
host, region |
| nr_mlock |
被 mlock() 锁定的页面数 |
页面 |
物理机 |
host, region |
| nr_shmem |
tmpfs / shmem 使用的页面数 |
页面 |
物理机 |
host, region |
| nr_slab_reclaimable |
可回收的 slab 缓存对象 |
页面 |
物理机 |
host, region |
| nr_slab_unreclaimable |
不可回收的 slab 缓存对象 |
页面 |
物理机 |
host, region |
- 脏页与写回控制, Dirty & writeback thresholds
| 指标 |
意义 |
单位 |
对象 |
标签 |
| nr_dirty |
当前脏页数 |
页面 |
物理机 |
host, region |
| nr_writeback |
正在写回的页面数 |
页面 |
物理机 |
host, region |
| nr_dirty_threshold |
脏页达到此阈值时开始强制写回(dirty_background_ratio / dirty_ratio 决定) |
页面 |
物理机 |
host, region |
| nr_dirty_background_threshold |
后台写回开始的阈值 |
页面 |
物理机 |
host, region |
| nr_dirty_background_threshold |
后台写回开始的阈值 |
页面 |
物理机 |
host, region |
- 页面错误与换页, Page fault & swapping
| 指标 |
意义 |
单位 |
对象 |
标签 |
| pgfault |
总缺页异常次数 |
计数 |
物理机 |
host, region |
| pgmajfault |
主缺页异常次数 |
计数 |
物理机 |
host, region |
| pgpgin |
从块设备读入的页面数 |
页面 |
物理机 |
host, region |
| pgpgout |
写出到块设备的页面数 |
页面 |
物理机 |
host, region |
| pswpin/pswpout |
换入/换出的页面数(swap) |
页面 |
物理机 |
host, region |
- 回收与扫描, Reclaim & scanning
| 指标 |
意义 |
单位 |
对象 |
标签 |
| pgscan_kswapd/direct/khugepaged |
kswapd/直接回收/khugepaged 扫描的页面数 |
页面数 |
物理机 |
host, region |
| pgsteal_kswapd/direct/khugepaged |
回收成功的页面数 |
页面数 |
物理机 |
host, region |
| 指标 |
意义 |
单位 |
对象 |
标签 |
| thp_fault_alloc |
缺页时成功分配 THP 的次数 |
计数 |
物理机 |
host, region |
| thp_fault_fallback |
缺页时分配 THP 失败而回落普通页的次数 |
计数 |
物理机 |
host, region |
| thp_collapse_alloc |
khugepaged 折叠成 THP 的成功次数 |
计数 |
物理机 |
host, region |
| thp_collapse_alloc_failed |
khugepaged 折叠 THP 的失败次数 |
计数 |
物理机 |
host, region |
- NUMA 相关统计, NUMA balancing & allocation
| 指标 |
意义 |
单位 |
对象 |
标签 |
| numa_hit |
进程希望从某个节点分配内存,并且成功在该节点上分配到的页面总数。 |
计数 |
物理机 |
host, region |
| numa_miss |
进程原本希望从其他节点分配,但由于目标节点内存不足等原因,最终在本节点分配成功的页面数。 |
计数 |
物理机 |
host, region |
| numa_foreign |
进程原本希望从本节点分配内存,但最终在其他节点分配成功的页面数。 |
计数 |
物理机 |
host, region |
| numa_local |
进程在本地节点上成功分配到的页面总数。 |
计数 |
物理机 |
host, region |
| numa_other |
进程在远程节点上分配到的页面总数。 |
计数 |
物理机 |
host, region |
| numa_pages_migrated |
由于自动 NUMA 平衡而成功迁移的页面总数 |
计数 |
物理机 |
host, region |
Ref:
资源事件
容器级别的内存事件指标。
# HELP huatuo_bamai_memory_events_container_high memory events high
# TYPE huatuo_bamai_memory_events_container_high gauge
huatuo_bamai_memory_events_container_high{container_host="coredns-855c4dd65d-8v5kg",container_hostnamespace="kube-system",container_level="burstable",container_name="coredns",container_type="normal",host="hostname",region="dev"} 0
# HELP huatuo_bamai_memory_events_container_low memory events low
# TYPE huatuo_bamai_memory_events_container_low gauge
huatuo_bamai_memory_events_container_low{container_host="coredns-855c4dd65d-8v5kg",container_hostnamespace="kube-system",container_level="burstable",container_name="coredns",container_type="normal",host="hostname",region="dev"} 0
# HELP huatuo_bamai_memory_events_container_max memory events max
# TYPE huatuo_bamai_memory_events_container_max gauge
huatuo_bamai_memory_events_container_max{container_host="coredns-855c4dd65d-8v5kg",container_hostnamespace="kube-system",container_level="burstable",container_name="coredns",container_type="normal",host="hostname",region="dev"} 0
# HELP huatuo_bamai_memory_events_container_oom memory events oom
# TYPE huatuo_bamai_memory_events_container_oom gauge
huatuo_bamai_memory_events_container_oom{container_host="coredns-855c4dd65d-8v5kg",container_hostnamespace="kube-system",container_level="burstable",container_name="coredns",container_type="normal",host="hostname",region="dev"} 0
# HELP huatuo_bamai_memory_events_container_oom_group_kill memory events oom_group_kill
# TYPE huatuo_bamai_memory_events_container_oom_group_kill gauge
huatuo_bamai_memory_events_container_oom_group_kill{container_host="coredns-855c4dd65d-8v5kg",container_hostnamespace="kube-system",container_level="burstable",container_name="coredns",container_type="normal",host="hostname",region="dev"} 0
# HELP huatuo_bamai_memory_events_container_oom_kill memory events oom_kill
# TYPE huatuo_bamai_memory_events_container_oom_kill gauge
huatuo_bamai_memory_events_container_oom_kill{container_host="coredns-855c4dd65d-8v5kg",container_hostnamespace="kube-system",container_level="burstable",container_name="coredns",container_type="normal",host="hostname",region="dev"} 0
| 指标 |
意义 |
单位 |
对象 |
标签 |
| memory_events_container_low |
使用量低于 memory.low,但由于系统内存压力大,仍被主动回收的次数。说明 memory.low 被过度承诺。 |
计数 |
容器 |
container_host, container_hostnamespace, container_level, container_name, container_type, host, region |
| memory_events_container_high |
内存使用量超过 memory.high(软限制),导致进程被节流并强制走直接回收的次数。 |
计数 |
容器 |
container_host, container_hostnamespace, container_level, container_name, container_type, host, region |
| memory_events_container_max |
内存使用量达到或即将超过 memory.max(硬限制),触发内存分配失败检查的次数。 |
计数 |
容器 |
container_host, container_hostnamespace, container_level, container_name, container_type, host, region |
| memory_events_container_oom |
内存使用量达到 memory.max 限制,导致内存分配失败,进入 OOM 路径的次数。 |
计数 |
容器 |
container_host, container_hostnamespace, container_level, container_name, container_type, host, region |
| memory_events_container_oom_kill |
cgroup 内因达到内存限制而被 OOM killer 杀死的进程数。 |
计数 |
容器 |
container_host, container_hostnamespace, container_level, container_name, container_type, host, region |
| memory_events_container_oom_group_kill |
整个 cgroup 被 OOM killer 杀死的次数。 |
计数 |
容器 |
container_host, container_hostnamespace, container_level, container_name, container_type, host, region |
Buddyinfo
展示 Buddy 分配器(内核页分配器核心算法)在每个 NUMA 节点(Node)和每个内存区域(Zone)中的空闲内存块分布情况。
# HELP huatuo_bamai_memory_buddyinfo_blocks buddy info
# TYPE huatuo_bamai_memory_buddyinfo_blocks gauge
huatuo_bamai_memory_buddyinfo_blocks{host="hostname",node="0",order="0",region="dev",zone="DMA"} 0
huatuo_bamai_memory_buddyinfo_blocks{host="hostname",node="0",order="0",region="dev",zone="DMA32"} 3
huatuo_bamai_memory_buddyinfo_blocks{host="hostname",node="0",order="0",region="dev",zone="Normal"} 7
huatuo_bamai_memory_buddyinfo_blocks{host="hostname",node="0",order="1",region="dev",zone="DMA"} 0
huatuo_bamai_memory_buddyinfo_blocks{host="hostname",node="0",order="1",region="dev",zone="DMA32"} 1
huatuo_bamai_memory_buddyinfo_blocks{host="hostname",node="0",order="1",region="dev",zone="Normal"} 36
huatuo_bamai_memory_buddyinfo_blocks{host="hostname",node="0",order="10",region="dev",zone="DMA"} 2
huatuo_bamai_memory_buddyinfo_blocks{host="hostname",node="0",order="10",region="dev",zone="DMA32"} 743
huatuo_bamai_memory_buddyinfo_blocks{host="hostname",node="0",order="10",region="dev",zone="Normal"} 2265
huatuo_bamai_memory_buddyinfo_blocks{host="hostname",node="0",order="2",region="dev",zone="DMA"} 0
huatuo_bamai_memory_buddyinfo_blocks{host="hostname",node="0",order="2",region="dev",zone="DMA32"} 3
huatuo_bamai_memory_buddyinfo_blocks{host="hostname",node="0",order="2",region="dev",zone="Normal"} 10
huatuo_bamai_memory_buddyinfo_blocks{host="hostname",node="0",order="3",region="dev",zone="DMA"} 0
huatuo_bamai_memory_buddyinfo_blocks{host="hostname",node="0",order="3",region="dev",zone="DMA32"} 2
huatuo_bamai_memory_buddyinfo_blocks{host="hostname",node="0",order="3",region="dev",zone="Normal"} 224
huatuo_bamai_memory_buddyinfo_blocks{host="hostname",node="0",order="4",region="dev",zone="DMA"} 0
huatuo_bamai_memory_buddyinfo_blocks{host="hostname",node="0",order="4",region="dev",zone="DMA32"} 1
huatuo_bamai_memory_buddyinfo_blocks{host="hostname",node="0",order="4",region="dev",zone="Normal"} 376
huatuo_bamai_memory_buddyinfo_blocks{host="hostname",node="0",order="5",region="dev",zone="DMA"} 0
huatuo_bamai_memory_buddyinfo_blocks{host="hostname",node="0",order="5",region="dev",zone="DMA32"} 1
huatuo_bamai_memory_buddyinfo_blocks{host="hostname",node="0",order="5",region="dev",zone="Normal"} 165
huatuo_bamai_memory_buddyinfo_blocks{host="hostname",node="0",order="6",region="dev",zone="DMA"} 0
huatuo_bamai_memory_buddyinfo_blocks{host="hostname",node="0",order="6",region="dev",zone="DMA32"} 3
huatuo_bamai_memory_buddyinfo_blocks{host="hostname",node="0",order="6",region="dev",zone="Normal"} 118
huatuo_bamai_memory_buddyinfo_blocks{host="hostname",node="0",order="7",region="dev",zone="DMA"} 0
huatuo_bamai_memory_buddyinfo_blocks{host="hostname",node="0",order="7",region="dev",zone="DMA32"} 4
huatuo_bamai_memory_buddyinfo_blocks{host="hostname",node="0",order="7",region="dev",zone="Normal"} 172
huatuo_bamai_memory_buddyinfo_blocks{host="hostname",node="0",order="8",region="dev",zone="DMA"} 1
huatuo_bamai_memory_buddyinfo_blocks{host="hostname",node="0",order="8",region="dev",zone="DMA32"} 4
huatuo_bamai_memory_buddyinfo_blocks{host="hostname",node="0",order="8",region="dev",zone="Normal"} 35
huatuo_bamai_memory_buddyinfo_blocks{host="hostname",node="0",order="9",region="dev",zone="DMA"} 2
huatuo_bamai_memory_buddyinfo_blocks{host="hostname",node="0",order="9",region="dev",zone="DMA32"} 4
huatuo_bamai_memory_buddyinfo_blocks{host="hostname",node="0",order="9",region="dev",zone="Normal"} 25
| 指标 |
意义 |
单位 |
对象 |
取值 |
标签 |
|
| memory_buddyinfo_blocks |
buddy 内存页空闲情况。 |
内存页 |
物理机 |
procfs |
host, node, order, region, zone |
|
网络系统
TCP 内存
如下指标描述 TCP 协议栈占用系统内存状态。
# HELP huatuo_bamai_tcp_memory_limit_pages tcp memory pages limit
# TYPE huatuo_bamai_tcp_memory_limit_pages gauge
huatuo_bamai_tcp_memory_limit_pages{host="hostname",region="dev"} 380526
# HELP huatuo_bamai_tcp_memory_usage_bytes tcp memory bytes usage
# TYPE huatuo_bamai_tcp_memory_usage_bytes gauge
huatuo_bamai_tcp_memory_usage_bytes{host="hostname",region="dev"} 0
# HELP huatuo_bamai_tcp_memory_usage_pages tcp memory pages usage
# TYPE huatuo_bamai_tcp_memory_usage_pages gauge
huatuo_bamai_tcp_memory_usage_pages{host="hostname",region="dev"} 0
# HELP huatuo_bamai_tcp_memory_usage_percent tcp memory usage percent
# TYPE huatuo_bamai_tcp_memory_usage_percent gauge
huatuo_bamai_tcp_memory_usage_percent{host="hostname",region="dev"} 0
| 指标 |
意义 |
单位 |
对象 |
标签 |
| tcp_memory_limit_pages |
系统可使用的 TCP 总内存大小 |
内存页 |
物理机 |
host, region |
| tcp_memory_usage_bytes |
系统已使用的 TCP 内存大小 |
字节 |
物理机 |
host, region |
| tcp_memory_usage_pages |
系统已使用的 TCP 内存大小 |
内存页 |
物理机 |
host, region |
| tcp_memory_usage_percent |
系统已使用的 TCP 内存百分比(相对 TCP 内存总限制) |
% |
物理机 |
host, region |
邻居项
如下指标描述邻居项使用状态。
# HELP huatuo_bamai_arp_container_entries arp entries in container netns
# TYPE huatuo_bamai_arp_container_entries gauge
huatuo_bamai_arp_container_entries{container_host="coredns-855c4dd65d-8v5kg",container_hostnamespace="kube-system",container_level="burstable",container_name="coredns",container_type="normal",host="hostname",region="dev"} 1
# HELP huatuo_bamai_arp_entries host init namespace
# TYPE huatuo_bamai_arp_entries gauge
huatuo_bamai_arp_entries{host="hostname",region="dev"} 5
# HELP huatuo_bamai_arp_total all entries in arp_cache for containers and host netns
# TYPE huatuo_bamai_arp_total gauge
huatuo_bamai_arp_total{host="hostname",region="dev"} 12
| 指标 |
意义 |
单位 |
对象 |
标签 |
| arp_entries |
宿主机网络命名空间 arp 条目数量 |
计数 |
宿主命名空间 |
host, region |
| arp_total |
物理机所有网络命名空间 arp 条目数量总和 |
计数 |
物理机 |
host, region |
| arp_container_entries |
容器网络命名空间 arp 条目数量 |
计数 |
容器 |
container_host, container_hostnamespace, container_level, container_name, container_type, host, region |
Qdisc
Qdisc 是内核网络子系统重要模块。通过观测该模块,可以清楚的看到网络报文处理,延迟情况。
# HELP huatuo_bamai_netdev_qdisc_backlog Number of bytes currently in queue to be sent.
# TYPE huatuo_bamai_netdev_qdisc_backlog gauge
huatuo_bamai_netdev_qdisc_backlog{device="ens2",host="hostname",kind="fq_codel",region="dev"} 0
# HELP huatuo_bamai_netdev_qdisc_bytes_total Number of bytes sent.
# TYPE huatuo_bamai_netdev_qdisc_bytes_total counter
huatuo_bamai_netdev_qdisc_bytes_total{device="ens2",host="hostname",kind="fq_codel",region="dev"} 2.578235443e+09
# HELP huatuo_bamai_netdev_qdisc_current_queue_length Number of packets currently in queue to be sent.
# TYPE huatuo_bamai_netdev_qdisc_current_queue_length gauge
huatuo_bamai_netdev_qdisc_current_queue_length{device="ens2",host="hostname",kind="fq_codel",region="dev"} 0
# HELP huatuo_bamai_netdev_qdisc_drops_total Number of packet drops.
# TYPE huatuo_bamai_netdev_qdisc_drops_total counter
huatuo_bamai_netdev_qdisc_drops_total{device="ens2",host="hostname",kind="fq_codel",region="dev"} 0
# HELP huatuo_bamai_netdev_qdisc_overlimits_total Number of packet overlimits.
# TYPE huatuo_bamai_netdev_qdisc_overlimits_total counter
huatuo_bamai_netdev_qdisc_overlimits_total{device="ens2",host="hostname",kind="fq_codel",region="dev"} 0
# HELP huatuo_bamai_netdev_qdisc_packets_total Number of packets sent.
# TYPE huatuo_bamai_netdev_qdisc_packets_total counter
huatuo_bamai_netdev_qdisc_packets_total{device="ens2",host="hostname",kind="fq_codel",region="dev"} 6.867714e+06
# HELP huatuo_bamai_netdev_qdisc_requeues_total Number of packets dequeued, not transmitted, and requeued.
# TYPE huatuo_bamai_netdev_qdisc_requeues_total counter
huatuo_bamai_netdev_qdisc_requeues_total{device="ens2",host="hostname",kind="fq_codel",region="dev"} 0
| 指标 |
意义 |
单位 |
对象 |
标签 |
| qdisc_backlog |
后备排队待发送的字节数 |
字节 |
物理机 |
device, host, kind, region |
| qdisc_current_queue_length |
当前排队的包量 |
计数 |
物理机 |
device, host, kind, region |
| qdisc_overlimits_total |
超限次数 |
计数 |
物理机 |
device, host, kind, region |
| qdisc_requeues_total |
由于网卡/驱动暂时无法发送而被重新入队的次数 |
计数 |
物理机 |
device, host, kind, region |
| qdisc_drops_total |
主动丢弃的包数(因队列满、限速策略等原因) |
计数 |
物理机 |
device, host, kind, region |
| qdisc_bytes_total |
已发送的包量 |
字节 |
物理机 |
device, host, kind, region |
| qdisc_packets_total |
已发送的包数 |
计数 |
物理机 |
device, host, kind, region |
硬件丢包
网络设备硬件接收方向丢包数。
# HELP huatuo_bamai_netdev_hw_rx_dropped count of packets dropped at hardware level
# TYPE huatuo_bamai_netdev_hw_rx_dropped gauge
huatuo_bamai_netdev_hw_rx_dropped{device="eth0",driver="mlx5_core",host="hostname",region="dev"} 0
| 指标 |
意义 |
单位 |
对象 |
取值 |
标签 |
| netdev_hw_rx_dropped |
网卡硬件接收方向丢包 |
计数 |
物理机 |
eBPF |
device, driver, host, region |
网络设备
# HELP huatuo_bamai_netdev_container_receive_bytes_total Network device statistic receive_bytes.
# TYPE huatuo_bamai_netdev_container_receive_bytes_total counter
huatuo_bamai_netdev_container_receive_bytes_total{container_host="coredns-855c4dd65d-8v5kg",container_hostnamespace="kube-system",container_level="burstable",container_name="coredns",container_type="normal",device="eth0",host="hostname",region="dev"} 6.4400018e+07
# HELP huatuo_bamai_netdev_container_receive_compressed_total Network device statistic receive_compressed.
# TYPE huatuo_bamai_netdev_container_receive_compressed_total counter
huatuo_bamai_netdev_container_receive_compressed_total{container_host="coredns-855c4dd65d-8v5kg",container_hostnamespace="kube-system",container_level="burstable",container_name="coredns",container_type="normal",device="eth0",host="hostname",region="dev"} 0
# HELP huatuo_bamai_netdev_container_receive_dropped_total Network device statistic receive_dropped.
# TYPE huatuo_bamai_netdev_container_receive_dropped_total counter
huatuo_bamai_netdev_container_receive_dropped_total{container_host="coredns-855c4dd65d-8v5kg",container_hostnamespace="kube-system",container_level="burstable",container_name="coredns",container_type="normal",device="eth0",host="hostname",region="dev"} 0
# HELP huatuo_bamai_netdev_container_receive_errors_total Network device statistic receive_errors.
# TYPE huatuo_bamai_netdev_container_receive_errors_total counter
huatuo_bamai_netdev_container_receive_errors_total{container_host="coredns-855c4dd65d-8v5kg",container_hostnamespace="kube-system",container_level="burstable",container_name="coredns",container_type="normal",device="eth0",host="hostname",region="dev"} 0
# HELP huatuo_bamai_netdev_container_receive_fifo_total Network device statistic receive_fifo.
# TYPE huatuo_bamai_netdev_container_receive_fifo_total counter
huatuo_bamai_netdev_container_receive_fifo_total{container_host="coredns-855c4dd65d-8v5kg",container_hostnamespace="kube-system",container_level="burstable",container_name="coredns",container_type="normal",device="eth0",host="hostname",region="dev"} 0
# HELP huatuo_bamai_netdev_container_receive_frame_total Network device statistic receive_frame.
# TYPE huatuo_bamai_netdev_container_receive_frame_total counter
huatuo_bamai_netdev_container_receive_frame_total{container_host="coredns-855c4dd65d-8v5kg",container_hostnamespace="kube-system",container_level="burstable",container_name="coredns",container_type="normal",device="eth0",host="hostname",region="dev"} 0
# HELP huatuo_bamai_netdev_container_receive_multicast_total Network device statistic receive_multicast.
# TYPE huatuo_bamai_netdev_container_receive_multicast_total counter
huatuo_bamai_netdev_container_receive_multicast_total{container_host="coredns-855c4dd65d-8v5kg",container_hostnamespace="kube-system",container_level="burstable",container_name="coredns",container_type="normal",device="eth0",host="hostname",region="dev"} 0
# HELP huatuo_bamai_netdev_container_receive_packets_total Network device statistic receive_packets.
# TYPE huatuo_bamai_netdev_container_receive_packets_total counter
huatuo_bamai_netdev_container_receive_packets_total{container_host="coredns-855c4dd65d-8v5kg",container_hostnamespace="kube-system",container_level="burstable",container_name="coredns",container_type="normal",device="eth0",host="hostname",region="dev"} 693155
# HELP huatuo_bamai_netdev_container_transmit_bytes_total Network device statistic transmit_bytes.
# TYPE huatuo_bamai_netdev_container_transmit_bytes_total counter
huatuo_bamai_netdev_container_transmit_bytes_total{container_host="coredns-855c4dd65d-8v5kg",container_hostnamespace="kube-system",container_level="burstable",container_name="coredns",container_type="normal",device="eth0",host="hostname",region="dev"} 6.2347911e+07
# HELP huatuo_bamai_netdev_container_transmit_carrier_total Network device statistic transmit_carrier.
# TYPE huatuo_bamai_netdev_container_transmit_carrier_total counter
huatuo_bamai_netdev_container_transmit_carrier_total{container_host="coredns-855c4dd65d-8v5kg",container_hostnamespace="kube-system",container_level="burstable",container_name="coredns",container_type="normal",device="eth0",host="hostname",region="dev"} 0
# HELP huatuo_bamai_netdev_container_transmit_colls_total Network device statistic transmit_colls.
# TYPE huatuo_bamai_netdev_container_transmit_colls_total counter
huatuo_bamai_netdev_container_transmit_colls_total{container_host="coredns-855c4dd65d-8v5kg",container_hostnamespace="kube-system",container_level="burstable",container_name="coredns",container_type="normal",device="eth0",host="hostname",region="dev"} 0
# HELP huatuo_bamai_netdev_container_transmit_compressed_total Network device statistic transmit_compressed.
# TYPE huatuo_bamai_netdev_container_transmit_compressed_total counter
huatuo_bamai_netdev_container_transmit_compressed_total{container_host="coredns-855c4dd65d-8v5kg",container_hostnamespace="kube-system",container_level="burstable",container_name="coredns",container_type="normal",device="eth0",host="hostname",region="dev"} 0
# HELP huatuo_bamai_netdev_container_transmit_dropped_total Network device statistic transmit_dropped.
# TYPE huatuo_bamai_netdev_container_transmit_dropped_total counter
huatuo_bamai_netdev_container_transmit_dropped_total{container_host="coredns-855c4dd65d-8v5kg",container_hostnamespace="kube-system",container_level="burstable",container_name="coredns",container_type="normal",device="eth0",host="hostname",region="dev"} 0
# HELP huatuo_bamai_netdev_container_transmit_errors_total Network device statistic transmit_errors.
# TYPE huatuo_bamai_netdev_container_transmit_errors_total counter
huatuo_bamai_netdev_container_transmit_errors_total{container_host="coredns-855c4dd65d-8v5kg",container_hostnamespace="kube-system",container_level="burstable",container_name="coredns",container_type="normal",device="eth0",host="hostname",region="dev"} 0
# HELP huatuo_bamai_netdev_container_transmit_fifo_total Network device statistic transmit_fifo.
# TYPE huatuo_bamai_netdev_container_transmit_fifo_total counter
huatuo_bamai_netdev_container_transmit_fifo_total{container_host="coredns-855c4dd65d-8v5kg",container_hostnamespace="kube-system",container_level="burstable",container_name="coredns",container_type="normal",device="eth0",host="hostname",region="dev"} 0
# HELP huatuo_bamai_netdev_container_transmit_packets_total Network device statistic transmit_packets.
# TYPE huatuo_bamai_netdev_container_transmit_packets_total counter
huatuo_bamai_netdev_container_transmit_packets_total{container_host="coredns-855c4dd65d-8v5kg",container_hostnamespace="kube-system",container_level="burstable",container_name="coredns",container_type="normal",device="eth0",host="hostname",region="dev"} 660218
| 指标 |
意义 |
单位 |
对象 |
标签 |
| netdev_receive_bytes_total |
成功接收的总字节数 |
计数 |
物理机或者容器 |
container_host, container_hostnamespace, container_level, container_name, container_type, host, region |
| netdev_receive_packets_total |
成功接收的数据包总数 |
计数 |
物理机或者容器 |
container_host, container_hostnamespace, container_level, container_name, container_type, host, region |
| netdev_receive_compressed_total |
接收到的已压缩数据包数 |
计数 |
物理机或者容器 |
container_host, container_hostnamespace, container_level, container_name, container_type, host, region |
| netdev_receive_frame_total |
接收帧错误数 |
计数 |
物理机或者容器 |
container_host, container_hostnamespace, container_level, container_name, container_type, host, region |
| netdev_receive_errors_total |
接收错误总数 |
计数 |
物理机或者容器 |
container_host, container_hostnamespace, container_level, container_name, container_type, host, region |
| netdev_receive_dropped_total |
由于各种原因被内核或驱动丢弃的接收包数 |
计数 |
物理机或者容器 |
container_host, container_hostnamespace, container_level, container_name, container_type, host, region |
| netdev_receive_fifo_total |
接收FIFO/环形缓冲区溢出错误数 |
计数 |
物理机或者容器 |
container_host, container_hostnamespace, container_level, container_name, container_type, host, region |
| netdev_transmit_bytes_total |
成功发送的总字节数 |
计数 |
物理机或者容器 |
container_host, container_hostnamespace, container_level, container_name, container_type, host, region |
| netdev_transmit_packets_total |
成功发送的数据包总数 |
计数 |
物理机或者容器 |
container_host, container_hostnamespace, container_level, container_name, container_type, host, region |
| netdev_transmit_errors_total |
发送错误总数 |
计数 |
物理机或者容器 |
container_host, container_hostnamespace, container_level, container_name, container_type, host, region |
| netdev_transmit_dropped_total |
发送过程中被丢弃的包数(队列满、策略丢弃等) |
计数 |
物理机或者容器 |
container_host, container_hostnamespace, container_level, container_name, container_type, host, region |
| netdev_transmit_fifo_total |
发送FIFO/环形缓冲区错误数 |
计数 |
物理机或者容器 |
container_host, container_hostnamespace, container_level, container_name, container_type, host, region |
| netdev_transmit_carrier_total |
载波错误次数 |
计数 |
物理机或者容器 |
container_host, container_hostnamespace, container_level, container_name, container_type, host, region |
| netdev_transmit_compressed_total |
发送的已压缩数据包数 |
计数 |
物理机或者容器 |
container_host, container_hostnamespace, container_level, container_name, container_type, host, region |
TCP
# HELP huatuo_bamai_netstat_container_TcpExt_ArpFilter statistic TcpExtArpFilter.
# TYPE huatuo_bamai_netstat_container_TcpExt_ArpFilter gauge
huatuo_bamai_netstat_container_TcpExt_ArpFilter{container_host="coredns-855c4dd65d-8v5kg",container_hostnamespace="kube-system",container_level="burstable",container_name="coredns",container_type="normal",host="hostname",region="dev"} 0
# HELP huatuo_bamai_netstat_container_TcpExt_BusyPollRxPackets statistic TcpExtBusyPollRxPackets.
# TYPE huatuo_bamai_netstat_container_TcpExt_BusyPollRxPackets gauge
huatuo_bamai_netstat_container_TcpExt_BusyPollRxPackets{container_host="coredns-855c4dd65d-8v5kg",container_hostnamespace="kube-system",container_level="burstable",container_name="coredns",container_type="normal",host="hostname",region="dev"} 0
# HELP huatuo_bamai_netstat_container_TcpExt_DelayedACKLocked statistic TcpExtDelayedACKLocked.
# TYPE huatuo_bamai_netstat_container_TcpExt_DelayedACKLocked gauge
huatuo_bamai_netstat_container_TcpExt_DelayedACKLocked{container_host="coredns-855c4dd65d-8v5kg",container_hostnamespace="kube-system",container_level="burstable",container_name="coredns",container_type="normal",host="hostname",region="dev"} 0
# HELP huatuo_bamai_netstat_container_TcpExt_DelayedACKLost statistic TcpExtDelayedACKLost.
# TYPE huatuo_bamai_netstat_container_TcpExt_DelayedACKLost gauge
huatuo_bamai_netstat_container_TcpExt_DelayedACKLost{container_host="coredns-855c4dd65d-8v5kg",container_hostnamespace="kube-system",container_level="burstable",container_name="coredns",container_type="normal",host="hostname",region="dev"} 0
# HELP huatuo_bamai_netstat_container_TcpExt_DelayedACKs statistic TcpExtDelayedACKs.
# TYPE huatuo_bamai_netstat_container_TcpExt_DelayedACKs gauge
huatuo_bamai_netstat_container_TcpExt_DelayedACKs{container_host="coredns-855c4dd65d-8v5kg",container_hostnamespace="kube-system",container_level="burstable",container_name="coredns",container_type="normal",host="hostname",region="dev"} 4650
# HELP huatuo_bamai_netstat_container_TcpExt_EmbryonicRsts statistic TcpExtEmbryonicRsts.
# TYPE huatuo_bamai_netstat_container_TcpExt_EmbryonicRsts gauge
huatuo_bamai_netstat_container_TcpExt_EmbryonicRsts{container_host="coredns-855c4dd65d-8v5kg",container_hostnamespace="kube-system",container_level="burstable",container_name="coredns",container_type="normal",host="hostname",region="dev"} 0
# HELP huatuo_bamai_netstat_container_TcpExt_IPReversePathFilter statistic TcpExtIPReversePathFilter.
# TYPE huatuo_bamai_netstat_container_TcpExt_IPReversePathFilter gauge
huatuo_bamai_netstat_container_TcpExt_IPReversePathFilter{container_host="coredns-855c4dd65d-8v5kg",container_hostnamespace="kube-system",container_level="burstable",container_name="coredns",container_type="normal",host="hostname",region="dev"} 0
# HELP huatuo_bamai_netstat_container_TcpExt_ListenDrops statistic TcpExtListenDrops.
# TYPE huatuo_bamai_netstat_container_TcpExt_ListenDrops gauge
huatuo_bamai_netstat_container_TcpExt_ListenDrops{container_host="coredns-855c4dd65d-8v5kg",container_hostnamespace="kube-system",container_level="burstable",container_name="coredns",container_type="normal",host="hostname",region="dev"} 0
# HELP huatuo_bamai_netstat_container_TcpExt_ListenOverflows statistic TcpExtListenOverflows.
# TYPE huatuo_bamai_netstat_container_TcpExt_ListenOverflows gauge
huatuo_bamai_netstat_container_TcpExt_ListenOverflows{container_host="coredns-855c4dd65d-8v5kg",container_hostnamespace="kube-system",container_level="burstable",container_name="coredns",container_type="normal",host="hostname",region="dev"} 0
# HELP huatuo_bamai_netstat_container_TcpExt_LockDroppedIcmps statistic TcpExtLockDroppedIcmps.
# TYPE huatuo_bamai_netstat_container_TcpExt_LockDroppedIcmps gauge
huatuo_bamai_netstat_container_TcpExt_LockDroppedIcmps{container_host="coredns-855c4dd65d-8v5kg",container_hostnamespace="kube-system",container_level="burstable",container_name="coredns",container_type="normal",host="hostname",region="dev"} 0
# HELP huatuo_bamai_netstat_container_TcpExt_OfoPruned statistic TcpExtOfoPruned.
# TYPE huatuo_bamai_netstat_container_TcpExt_OfoPruned gauge
huatuo_bamai_netstat_container_TcpExt_OfoPruned{container_host="coredns-855c4dd65d-8v5kg",container_hostnamespace="kube-system",container_level="burstable",container_name="coredns",container_type="normal",host="hostname",region="dev"} 0
# HELP huatuo_bamai_netstat_container_TcpExt_OutOfWindowIcmps statistic TcpExtOutOfWindowIcmps.
# TYPE huatuo_bamai_netstat_container_TcpExt_OutOfWindowIcmps gauge
huatuo_bamai_netstat_container_TcpExt_OutOfWindowIcmps{container_host="coredns-855c4dd65d-8v5kg",container_hostnamespace="kube-system",container_level="burstable",container_name="coredns",container_type="normal",host="hostname",region="dev"} 0
# HELP huatuo_bamai_netstat_container_TcpExt_PAWSActive statistic TcpExtPAWSActive.
# TYPE huatuo_bamai_netstat_container_TcpExt_PAWSActive gauge
huatuo_bamai_netstat_container_TcpExt_PAWSActive{container_host="coredns-855c4dd65d-8v5kg",container_hostnamespace="kube-system",container_level="burstable",container_name="coredns",container_type="normal",host="hostname",region="dev"} 0
# HELP huatuo_bamai_netstat_container_TcpExt_PAWSEstab statistic TcpExtPAWSEstab.
# TYPE huatuo_bamai_netstat_container_TcpExt_PAWSEstab gauge
huatuo_bamai_netstat_container_TcpExt_PAWSEstab{container_host="coredns-855c4dd65d-8v5kg",container_hostnamespace="kube-system",container_level="burstable",container_name="coredns",container_type="normal",host="hostname",region="dev"} 0
# HELP huatuo_bamai_netstat_container_TcpExt_PFMemallocDrop statistic TcpExtPFMemallocDrop.
# TYPE huatuo_bamai_netstat_container_TcpExt_PFMemallocDrop gauge
huatuo_bamai_netstat_container_TcpExt_PFMemallocDrop{container_host="coredns-855c4dd65d-8v5kg",container_hostnamespace="kube-system",container_level="burstable",container_name="coredns",container_type="normal",host="hostname",region="dev"} 0
# HELP huatuo_bamai_netstat_container_TcpExt_PruneCalled statistic TcpExtPruneCalled.
# TYPE huatuo_bamai_netstat_container_TcpExt_PruneCalled gauge
huatuo_bamai_netstat_container_TcpExt_PruneCalled{container_host="coredns-855c4dd65d-8v5kg",container_hostnamespace="kube-system",container_level="burstable",container_name="coredns",container_type="normal",host="hostname",region="dev"} 0
# HELP huatuo_bamai_netstat_container_TcpExt_RcvPruned statistic TcpExtRcvPruned.
# TYPE huatuo_bamai_netstat_container_TcpExt_RcvPruned gauge
huatuo_bamai_netstat_container_TcpExt_RcvPruned{container_host="coredns-855c4dd65d-8v5kg",container_hostnamespace="kube-system",container_level="burstable",container_name="coredns",container_type="normal",host="hostname",region="dev"} 0
# HELP huatuo_bamai_netstat_container_TcpExt_SyncookiesFailed statistic TcpExtSyncookiesFailed.
# TYPE huatuo_bamai_netstat_container_TcpExt_SyncookiesFailed gauge
huatuo_bamai_netstat_container_TcpExt_SyncookiesFailed{container_host="coredns-855c4dd65d-8v5kg",container_hostnamespace="kube-system",container_level="burstable",container_name="coredns",container_type="normal",host="hostname",region="dev"} 0
# HELP huatuo_bamai_netstat_container_TcpExt_SyncookiesRecv statistic TcpExtSyncookiesRecv.
# TYPE huatuo_bamai_netstat_container_TcpExt_SyncookiesRecv gauge
huatuo_bamai_netstat_container_TcpExt_SyncookiesRecv{container_host="coredns-855c4dd65d-8v5kg",container_hostnamespace="kube-system",container_level="burstable",container_name="coredns",container_type="normal",host="hostname",region="dev"} 0
# HELP huatuo_bamai_netstat_container_TcpExt_SyncookiesSent statistic TcpExtSyncookiesSent.
# TYPE huatuo_bamai_netstat_container_TcpExt_SyncookiesSent gauge
huatuo_bamai_netstat_container_TcpExt_SyncookiesSent{container_host="coredns-855c4dd65d-8v5kg",container_hostnamespace="kube-system",container_level="burstable",container_name="coredns",container_type="normal",host="hostname",region="dev"} 0
# HELP huatuo_bamai_netstat_container_TcpExt_TCPACKSkippedChallenge statistic TcpExtTCPACKSkippedChallenge.
# TYPE huatuo_bamai_netstat_container_TcpExt_TCPACKSkippedChallenge gauge
huatuo_bamai_netstat_container_TcpExt_TCPACKSkippedChallenge{container_host="coredns-855c4dd65d-8v5kg",container_hostnamespace="kube-system",container_level="burstable",container_name="coredns",container_type="normal",host="hostname",region="dev"} 0
# HELP huatuo_bamai_netstat_container_TcpExt_TCPACKSkippedFinWait2 statistic TcpExtTCPACKSkippedFinWait2.
# TYPE huatuo_bamai_netstat_container_TcpExt_TCPACKSkippedFinWait2 gauge
huatuo_bamai_netstat_container_TcpExt_TCPACKSkippedFinWait2{container_host="coredns-855c4dd65d-8v5kg",container_hostnamespace="kube-system",container_level="burstable",container_name="coredns",container_type="normal",host="hostname",region="dev"} 0
# HELP huatuo_bamai_netstat_container_TcpExt_TCPACKSkippedPAWS statistic TcpExtTCPACKSkippedPAWS.
# TYPE huatuo_bamai_netstat_container_TcpExt_TCPACKSkippedPAWS gauge
huatuo_bamai_netstat_container_TcpExt_TCPACKSkippedPAWS{container_host="coredns-855c4dd65d-8v5kg",container_hostnamespace="kube-system",container_level="burstable",container_name="coredns",container_type="normal",host="hostname",region="dev"} 0
# HELP huatuo_bamai_netstat_container_TcpExt_TCPACKSkippedSeq statistic TcpExtTCPACKSkippedSeq.
# TYPE huatuo_bamai_netstat_container_TcpExt_TCPACKSkippedSeq gauge
huatuo_bamai_netstat_container_TcpExt_TCPACKSkippedSeq{container_host="coredns-855c4dd65d-8v5kg",container_hostnamespace="kube-system",container_level="burstable",container_name="coredns",container_type="normal",host="hostname",region="dev"} 0
# HELP huatuo_bamai_netstat_container_TcpExt_TCPACKSkippedSynRecv statistic TcpExtTCPACKSkippedSynRecv.
# TYPE huatuo_bamai_netstat_container_TcpExt_TCPACKSkippedSynRecv gauge
huatuo_bamai_netstat_container_TcpExt_TCPACKSkippedSynRecv{container_host="coredns-855c4dd65d-8v5kg",container_hostnamespace="kube-system",container_level="burstable",container_name="coredns",container_type="normal",host="hostname",region="dev"} 0
# HELP huatuo_bamai_netstat_container_TcpExt_TCPACKSkippedTimeWait statistic TcpExtTCPACKSkippedTimeWait.
# TYPE huatuo_bamai_netstat_container_TcpExt_TCPACKSkippedTimeWait gauge
huatuo_bamai_netstat_container_TcpExt_TCPACKSkippedTimeWait{container_host="coredns-855c4dd65d-8v5kg",container_hostnamespace="kube-system",container_level="burstable",container_name="coredns",container_type="normal",host="hostname",region="dev"} 0
# HELP huatuo_bamai_netstat_container_TcpExt_TCPAOBad statistic TcpExtTCPAOBad.
# TYPE huatuo_bamai_netstat_container_TcpExt_TCPAOBad gauge
huatuo_bamai_netstat_container_TcpExt_TCPAOBad{container_host="coredns-855c4dd65d-8v5kg",container_hostnamespace="kube-system",container_level="burstable",container_name="coredns",container_type="normal",host="hostname",region="dev"} 0
# HELP huatuo_bamai_netstat_container_TcpExt_TCPAODroppedIcmps statistic TcpExtTCPAODroppedIcmps.
# TYPE huatuo_bamai_netstat_container_TcpExt_TCPAODroppedIcmps gauge
huatuo_bamai_netstat_container_TcpExt_TCPAODroppedIcmps{container_host="coredns-855c4dd65d-8v5kg",container_hostnamespace="kube-system",container_level="burstable",container_name="coredns",container_type="normal",host="hostname",region="dev"} 0
# HELP huatuo_bamai_netstat_container_TcpExt_TCPAOGood statistic TcpExtTCPAOGood.
# TYPE huatuo_bamai_netstat_container_TcpExt_TCPAOGood gauge
huatuo_bamai_netstat_container_TcpExt_TCPAOGood{container_host="coredns-855c4dd65d-8v5kg",container_hostnamespace="kube-system",container_level="burstable",container_name="coredns",container_type="normal",host="hostname",region="dev"} 0
# HELP huatuo_bamai_netstat_container_TcpExt_TCPAOKeyNotFound statistic TcpExtTCPAOKeyNotFound.
# TYPE huatuo_bamai_netstat_container_TcpExt_TCPAOKeyNotFound gauge
huatuo_bamai_netstat_container_TcpExt_TCPAOKeyNotFound{container_host="coredns-855c4dd65d-8v5kg",container_hostnamespace="kube-system",container_level="burstable",container_name="coredns",container_type="normal",host="hostname",region="dev"} 0
# HELP huatuo_bamai_netstat_container_TcpExt_TCPAORequired statistic TcpExtTCPAORequired.
# TYPE huatuo_bamai_netstat_container_TcpExt_TCPAORequired gauge
huatuo_bamai_netstat_container_TcpExt_TCPAORequired{container_host="coredns-855c4dd65d-8v5kg",container_hostnamespace="kube-system",container_level="burstable",container_name="coredns",container_type="normal",host="hostname",region="dev"} 0
# HELP huatuo_bamai_netstat_container_TcpExt_TCPAbortFailed statistic TcpExtTCPAbortFailed.
# TYPE huatuo_bamai_netstat_container_TcpExt_TCPAbortFailed gauge
huatuo_bamai_netstat_container_TcpExt_TCPAbortFailed{container_host="coredns-855c4dd65d-8v5kg",container_hostnamespace="kube-system",container_level="burstable",container_name="coredns",container_type="normal",host="hostname",region="dev"} 0
# HELP huatuo_bamai_netstat_container_TcpExt_TCPAbortOnClose statistic TcpExtTCPAbortOnClose.
# TYPE huatuo_bamai_netstat_container_TcpExt_TCPAbortOnClose gauge
huatuo_bamai_netstat_container_TcpExt_TCPAbortOnClose{container_host="coredns-855c4dd65d-8v5kg",container_hostnamespace="kube-system",container_level="burstable",container_name="coredns",container_type="normal",host="hostname",region="dev"} 1
# HELP huatuo_bamai_netstat_container_TcpExt_TCPAbortOnData statistic TcpExtTCPAbortOnData.
# TYPE huatuo_bamai_netstat_container_TcpExt_TCPAbortOnData gauge
huatuo_bamai_netstat_container_TcpExt_TCPAbortOnData{container_host="coredns-855c4dd65d-8v5kg",container_hostnamespace="kube-system",container_level="burstable",container_name="coredns",container_type="normal",host="hostname",region="dev"} 0
# HELP huatuo_bamai_netstat_container_TcpExt_TCPAbortOnLinger statistic TcpExtTCPAbortOnLinger.
# TYPE huatuo_bamai_netstat_container_TcpExt_TCPAbortOnLinger gauge
huatuo_bamai_netstat_container_TcpExt_TCPAbortOnLinger{container_host="coredns-855c4dd65d-8v5kg",container_hostnamespace="kube-system",container_level="burstable",container_name="coredns",container_type="normal",host="hostname",region="dev"} 0
# HELP huatuo_bamai_netstat_container_TcpExt_TCPAbortOnMemory statistic TcpExtTCPAbortOnMemory.
# TYPE huatuo_bamai_netstat_container_TcpExt_TCPAbortOnMemory gauge
huatuo_bamai_netstat_container_TcpExt_TCPAbortOnMemory{container_host="coredns-855c4dd65d-8v5kg",container_hostnamespace="kube-system",container_level="burstable",container_name="coredns",container_type="normal",host="hostname",region="dev"} 0
# HELP huatuo_bamai_netstat_container_TcpExt_TCPAbortOnTimeout statistic TcpExtTCPAbortOnTimeout.
# TYPE huatuo_bamai_netstat_container_TcpExt_TCPAbortOnTimeout gauge
huatuo_bamai_netstat_container_TcpExt_TCPAbortOnTimeout{container_host="coredns-855c4dd65d-8v5kg",container_hostnamespace="kube-system",container_level="burstable",container_name="coredns",container_type="normal",host="hostname",region="dev"} 0
# HELP huatuo_bamai_netstat_container_TcpExt_TCPAckCompressed statistic TcpExtTCPAckCompressed.
# TYPE huatuo_bamai_netstat_container_TcpExt_TCPAckCompressed gauge
huatuo_bamai_netstat_container_TcpExt_TCPAckCompressed{container_host="coredns-855c4dd65d-8v5kg",container_hostnamespace="kube-system",container_level="burstable",container_name="coredns",container_type="normal",host="hostname",region="dev"} 0
# HELP huatuo_bamai_netstat_container_TcpExt_TCPAutoCorking statistic TcpExtTCPAutoCorking.
# TYPE huatuo_bamai_netstat_container_TcpExt_TCPAutoCorking gauge
huatuo_bamai_netstat_container_TcpExt_TCPAutoCorking{container_host="coredns-855c4dd65d-8v5kg",container_hostnamespace="kube-system",container_level="burstable",container_name="coredns",container_type="normal",host="hostname",region="dev"} 0
# HELP huatuo_bamai_netstat_container_TcpExt_TCPBacklogCoalesce statistic TcpExtTCPBacklogCoalesce.
# TYPE huatuo_bamai_netstat_container_TcpExt_TCPBacklogCoalesce gauge
huatuo_bamai_netstat_container_TcpExt_TCPBacklogCoalesce{container_host="coredns-855c4dd65d-8v5kg",container_hostnamespace="kube-system",container_level="burstable",container_name="coredns",container_type="normal",host="hostname",region="dev"} 3
# HELP huatuo_bamai_netstat_container_TcpExt_TCPBacklogDrop statistic TcpExtTCPBacklogDrop.
# TYPE huatuo_bamai_netstat_container_TcpExt_TCPBacklogDrop gauge
huatuo_bamai_netstat_container_TcpExt_TCPBacklogDrop{container_host="coredns-855c4dd65d-8v5kg",container_hostnamespace="kube-system",container_level="burstable",container_name="coredns",container_type="normal",host="hostname",region="dev"} 0
# HELP huatuo_bamai_netstat_container_TcpExt_TCPChallengeACK statistic TcpExtTCPChallengeACK.
# TYPE huatuo_bamai_netstat_container_TcpExt_TCPChallengeACK gauge
huatuo_bamai_netstat_container_TcpExt_TCPChallengeACK{container_host="coredns-855c4dd65d-8v5kg",container_hostnamespace="kube-system",container_level="burstable",container_name="coredns",container_type="normal",host="hostname",region="dev"} 0
# HELP huatuo_bamai_netstat_container_TcpExt_TCPDSACKIgnoredDubious statistic TcpExtTCPDSACKIgnoredDubious.
# TYPE huatuo_bamai_netstat_container_TcpExt_TCPDSACKIgnoredDubious gauge
huatuo_bamai_netstat_container_TcpExt_TCPDSACKIgnoredDubious{container_host="coredns-855c4dd65d-8v5kg",container_hostnamespace="kube-system",container_level="burstable",container_name="coredns",container_type="normal",host="hostname",region="dev"} 0
# HELP huatuo_bamai_netstat_container_TcpExt_TCPDSACKIgnoredNoUndo statistic TcpExtTCPDSACKIgnoredNoUndo.
# TYPE huatuo_bamai_netstat_container_TcpExt_TCPDSACKIgnoredNoUndo gauge
huatuo_bamai_netstat_container_TcpExt_TCPDSACKIgnoredNoUndo{container_host="coredns-855c4dd65d-8v5kg",container_hostnamespace="kube-system",container_level="burstable",container_name="coredns",container_type="normal",host="hostname",region="dev"} 1
# HELP huatuo_bamai_netstat_container_TcpExt_TCPDSACKIgnoredOld statistic TcpExtTCPDSACKIgnoredOld.
# TYPE huatuo_bamai_netstat_container_TcpExt_TCPDSACKIgnoredOld gauge
huatuo_bamai_netstat_container_TcpExt_TCPDSACKIgnoredOld{container_host="coredns-855c4dd65d-8v5kg",container_hostnamespace="kube-system",container_level="burstable",container_name="coredns",container_type="normal",host="hostname",region="dev"} 0
# HELP huatuo_bamai_netstat_container_TcpExt_TCPDSACKOfoRecv statistic TcpExtTCPDSACKOfoRecv.
# TYPE huatuo_bamai_netstat_container_TcpExt_TCPDSACKOfoRecv gauge
huatuo_bamai_netstat_container_TcpExt_TCPDSACKOfoRecv{container_host="coredns-855c4dd65d-8v5kg",container_hostnamespace="kube-system",container_level="burstable",container_name="coredns",container_type="normal",host="hostname",region="dev"} 0
# HELP huatuo_bamai_netstat_container_TcpExt_TCPDSACKOfoSent statistic TcpExtTCPDSACKOfoSent.
# TYPE huatuo_bamai_netstat_container_TcpExt_TCPDSACKOfoSent gauge
huatuo_bamai_netstat_container_TcpExt_TCPDSACKOfoSent{container_host="coredns-855c4dd65d-8v5kg",container_hostnamespace="kube-system",container_level="burstable",container_name="coredns",container_type="normal",host="hostname",region="dev"} 0
# HELP huatuo_bamai_netstat_container_TcpExt_TCPDSACKOldSent statistic TcpExtTCPDSACKOldSent.
# TYPE huatuo_bamai_netstat_container_TcpExt_TCPDSACKOldSent gauge
huatuo_bamai_netstat_container_TcpExt_TCPDSACKOldSent{container_host="coredns-855c4dd65d-8v5kg",container_hostnamespace="kube-system",container_level="burstable",container_name="coredns",container_type="normal",host="hostname",region="dev"} 0
# HELP huatuo_bamai_netstat_container_TcpExt_TCPDSACKRecv statistic TcpExtTCPDSACKRecv.
# TYPE huatuo_bamai_netstat_container_TcpExt_TCPDSACKRecv gauge
huatuo_bamai_netstat_container_TcpExt_TCPDSACKRecv{container_host="coredns-855c4dd65d-8v5kg",container_hostnamespace="kube-system",container_level="burstable",container_name="coredns",container_type="normal",host="hostname",region="dev"} 1
# HELP huatuo_bamai_netstat_container_TcpExt_TCPDSACKRecvSegs statistic TcpExtTCPDSACKRecvSegs.
# TYPE huatuo_bamai_netstat_container_TcpExt_TCPDSACKRecvSegs gauge
huatuo_bamai_netstat_container_TcpExt_TCPDSACKRecvSegs{container_host="coredns-855c4dd65d-8v5kg",container_hostnamespace="kube-system",container_level="burstable",container_name="coredns",container_type="normal",host="hostname",region="dev"} 1
# HELP huatuo_bamai_netstat_container_TcpExt_TCPDSACKUndo statistic TcpExtTCPDSACKUndo.
# TYPE huatuo_bamai_netstat_container_TcpExt_TCPDSACKUndo gauge
huatuo_bamai_netstat_container_TcpExt_TCPDSACKUndo{container_host="coredns-855c4dd65d-8v5kg",container_hostnamespace="kube-system",container_level="burstable",container_name="coredns",container_type="normal",host="hostname",region="dev"} 0
# HELP huatuo_bamai_netstat_container_TcpExt_TCPDeferAcceptDrop statistic TcpExtTCPDeferAcceptDrop.
# TYPE huatuo_bamai_netstat_container_TcpExt_TCPDeferAcceptDrop gauge
huatuo_bamai_netstat_container_TcpExt_TCPDeferAcceptDrop{container_host="coredns-855c4dd65d-8v5kg",container_hostnamespace="kube-system",container_level="burstable",container_name="coredns",container_type="normal",host="hostname",region="dev"} 0
# HELP huatuo_bamai_netstat_container_TcpExt_TCPDelivered statistic TcpExtTCPDelivered.
# TYPE huatuo_bamai_netstat_container_TcpExt_TCPDelivered gauge
huatuo_bamai_netstat_container_TcpExt_TCPDelivered{container_host="coredns-855c4dd65d-8v5kg",container_hostnamespace="kube-system",container_level="burstable",container_name="coredns",container_type="normal",host="hostname",region="dev"} 3.28098e+06
# HELP huatuo_bamai_netstat_container_TcpExt_TCPDeliveredCE statistic TcpExtTCPDeliveredCE.
# TYPE huatuo_bamai_netstat_container_TcpExt_TCPDeliveredCE gauge
huatuo_bamai_netstat_container_TcpExt_TCPDeliveredCE{container_host="coredns-855c4dd65d-8v5kg",container_hostnamespace="kube-system",container_level="burstable",container_name="coredns",container_type="normal",host="hostname",region="dev"} 0
# HELP huatuo_bamai_netstat_container_TcpExt_TCPFastOpenActive statistic TcpExtTCPFastOpenActive.
# TYPE huatuo_bamai_netstat_container_TcpExt_TCPFastOpenActive gauge
huatuo_bamai_netstat_container_TcpExt_TCPFastOpenActive{container_host="coredns-855c4dd65d-8v5kg",container_hostnamespace="kube-system",container_level="burstable",container_name="coredns",container_type="normal",host="hostname",region="dev"} 0
# HELP huatuo_bamai_netstat_container_TcpExt_TCPFastOpenActiveFail statistic TcpExtTCPFastOpenActiveFail.
# TYPE huatuo_bamai_netstat_container_TcpExt_TCPFastOpenActiveFail gauge
huatuo_bamai_netstat_container_TcpExt_TCPFastOpenActiveFail{container_host="coredns-855c4dd65d-8v5kg",container_hostnamespace="kube-system",container_level="burstable",container_name="coredns",container_type="normal",host="hostname",region="dev"} 0
# HELP huatuo_bamai_netstat_container_TcpExt_TCPFastOpenBlackhole statistic TcpExtTCPFastOpenBlackhole.
# TYPE huatuo_bamai_netstat_container_TcpExt_TCPFastOpenBlackhole gauge
huatuo_bamai_netstat_container_TcpExt_TCPFastOpenBlackhole{container_host="coredns-855c4dd65d-8v5kg",container_hostnamespace="kube-system",container_level="burstable",container_name="coredns",container_type="normal",host="hostname",region="dev"} 0
# HELP huatuo_bamai_netstat_container_TcpExt_TCPFastOpenCookieReqd statistic TcpExtTCPFastOpenCookieReqd.
# TYPE huatuo_bamai_netstat_container_TcpExt_TCPFastOpenCookieReqd gauge
huatuo_bamai_netstat_container_TcpExt_TCPFastOpenCookieReqd{container_host="coredns-855c4dd65d-8v5kg",container_hostnamespace="kube-system",container_level="burstable",container_name="coredns",container_type="normal",host="hostname",region="dev"} 0
# HELP huatuo_bamai_netstat_container_TcpExt_TCPFastOpenListenOverflow statistic TcpExtTCPFastOpenListenOverflow.
# TYPE huatuo_bamai_netstat_container_TcpExt_TCPFastOpenListenOverflow gauge
huatuo_bamai_netstat_container_TcpExt_TCPFastOpenListenOverflow{container_host="coredns-855c4dd65d-8v5kg",container_hostnamespace="kube-system",container_level="burstable",container_name="coredns",container_type="normal",host="hostname",region="dev"} 0
# HELP huatuo_bamai_netstat_container_TcpExt_TCPFastOpenPassive statistic TcpExtTCPFastOpenPassive.
# TYPE huatuo_bamai_netstat_container_TcpExt_TCPFastOpenPassive gauge
huatuo_bamai_netstat_container_TcpExt_TCPFastOpenPassive{container_host="coredns-855c4dd65d-8v5kg",container_hostnamespace="kube-system",container_level="burstable",container_name="coredns",container_type="normal",host="hostname",region="dev"} 0
# HELP huatuo_bamai_netstat_container_TcpExt_TCPFastOpenPassiveAltKey statistic TcpExtTCPFastOpenPassiveAltKey.
# TYPE huatuo_bamai_netstat_container_TcpExt_TCPFastOpenPassiveAltKey gauge
huatuo_bamai_netstat_container_TcpExt_TCPFastOpenPassiveAltKey{container_host="coredns-855c4dd65d-8v5kg",container_hostnamespace="kube-system",container_level="burstable",container_name="coredns",container_type="normal",host="hostname",region="dev"} 0
# HELP huatuo_bamai_netstat_container_TcpExt_TCPFastOpenPassiveFail statistic TcpExtTCPFastOpenPassiveFail.
# TYPE huatuo_bamai_netstat_container_TcpExt_TCPFastOpenPassiveFail gauge
huatuo_bamai_netstat_container_TcpExt_TCPFastOpenPassiveFail{container_host="coredns-855c4dd65d-8v5kg",container_hostnamespace="kube-system",container_level="burstable",container_name="coredns",container_type="normal",host="hostname",region="dev"} 0
# HELP huatuo_bamai_netstat_container_TcpExt_TCPFastRetrans statistic TcpExtTCPFastRetrans.
# TYPE huatuo_bamai_netstat_container_TcpExt_TCPFastRetrans gauge
huatuo_bamai_netstat_container_TcpExt_TCPFastRetrans{container_host="coredns-855c4dd65d-8v5kg",container_hostnamespace="kube-system",container_level="burstable",container_name="coredns",container_type="normal",host="hostname",region="dev"} 0
# HELP huatuo_bamai_netstat_container_TcpExt_TCPFromZeroWindowAdv statistic TcpExtTCPFromZeroWindowAdv.
# TYPE huatuo_bamai_netstat_container_TcpExt_TCPFromZeroWindowAdv gauge
huatuo_bamai_netstat_container_TcpExt_TCPFromZeroWindowAdv{container_host="coredns-855c4dd65d-8v5kg",container_hostnamespace="kube-system",container_level="burstable",container_name="coredns",container_type="normal",host="hostname",region="dev"} 0
# HELP huatuo_bamai_netstat_container_TcpExt_TCPFullUndo statistic TcpExtTCPFullUndo.
# TYPE huatuo_bamai_netstat_container_TcpExt_TCPFullUndo gauge
huatuo_bamai_netstat_container_TcpExt_TCPFullUndo{container_host="coredns-855c4dd65d-8v5kg",container_hostnamespace="kube-system",container_level="burstable",container_name="coredns",container_type="normal",host="hostname",region="dev"} 0
# HELP huatuo_bamai_netstat_container_TcpExt_TCPHPAcks statistic TcpExtTCPHPAcks.
# TYPE huatuo_bamai_netstat_container_TcpExt_TCPHPAcks gauge
huatuo_bamai_netstat_container_TcpExt_TCPHPAcks{container_host="coredns-855c4dd65d-8v5kg",container_hostnamespace="kube-system",container_level="burstable",container_name="coredns",container_type="normal",host="hostname",region="dev"} 616667
# HELP huatuo_bamai_netstat_container_TcpExt_TCPHPHits statistic TcpExtTCPHPHits.
# TYPE huatuo_bamai_netstat_container_TcpExt_TCPHPHits gauge
huatuo_bamai_netstat_container_TcpExt_TCPHPHits{container_host="coredns-855c4dd65d-8v5kg",container_hostnamespace="kube-system",container_level="burstable",container_name="coredns",container_type="normal",host="hostname",region="dev"} 9913
# HELP huatuo_bamai_netstat_container_TcpExt_TCPHystartDelayCwnd statistic TcpExtTCPHystartDelayCwnd.
# TYPE huatuo_bamai_netstat_container_TcpExt_TCPHystartDelayCwnd gauge
huatuo_bamai_netstat_container_TcpExt_TCPHystartDelayCwnd{container_host="coredns-855c4dd65d-8v5kg",container_hostnamespace="kube-system",container_level="burstable",container_name="coredns",container_type="normal",host="hostname",region="dev"} 0
# HELP huatuo_bamai_netstat_container_TcpExt_TCPHystartDelayDetect statistic TcpExtTCPHystartDelayDetect.
# TYPE huatuo_bamai_netstat_container_TcpExt_TCPHystartDelayDetect gauge
huatuo_bamai_netstat_container_TcpExt_TCPHystartDelayDetect{container_host="coredns-855c4dd65d-8v5kg",container_hostnamespace="kube-system",container_level="burstable",container_name="coredns",container_type="normal",host="hostname",region="dev"} 0
# HELP huatuo_bamai_netstat_container_TcpExt_TCPHystartTrainCwnd statistic TcpExtTCPHystartTrainCwnd.
# TYPE huatuo_bamai_netstat_container_TcpExt_TCPHystartTrainCwnd gauge
huatuo_bamai_netstat_container_TcpExt_TCPHystartTrainCwnd{container_host="coredns-855c4dd65d-8v5kg",container_hostnamespace="kube-system",container_level="burstable",container_name="coredns",container_type="normal",host="hostname",region="dev"} 0
# HELP huatuo_bamai_netstat_container_TcpExt_TCPHystartTrainDetect statistic TcpExtTCPHystartTrainDetect.
# TYPE huatuo_bamai_netstat_container_TcpExt_TCPHystartTrainDetect gauge
huatuo_bamai_netstat_container_TcpExt_TCPHystartTrainDetect{container_host="coredns-855c4dd65d-8v5kg",container_hostnamespace="kube-system",container_level="burstable",container_name="coredns",container_type="normal",host="hostname",region="dev"} 0
# HELP huatuo_bamai_netstat_container_TcpExt_TCPKeepAlive statistic TcpExtTCPKeepAlive.
# TYPE huatuo_bamai_netstat_container_TcpExt_TCPKeepAlive gauge
huatuo_bamai_netstat_container_TcpExt_TCPKeepAlive{container_host="coredns-855c4dd65d-8v5kg",container_hostnamespace="kube-system",container_level="burstable",container_name="coredns",container_type="normal",host="hostname",region="dev"} 20
# HELP huatuo_bamai_netstat_container_TcpExt_TCPLossFailures statistic TcpExtTCPLossFailures.
# TYPE huatuo_bamai_netstat_container_TcpExt_TCPLossFailures gauge
huatuo_bamai_netstat_container_TcpExt_TCPLossFailures{container_host="coredns-855c4dd65d-8v5kg",container_hostnamespace="kube-system",container_level="burstable",container_name="coredns",container_type="normal",host="hostname",region="dev"} 0
# HELP huatuo_bamai_netstat_container_TcpExt_TCPLossProbeRecovery statistic TcpExtTCPLossProbeRecovery.
# TYPE huatuo_bamai_netstat_container_TcpExt_TCPLossProbeRecovery gauge
huatuo_bamai_netstat_container_TcpExt_TCPLossProbeRecovery{container_host="coredns-855c4dd65d-8v5kg",container_hostnamespace="kube-system",container_level="burstable",container_name="coredns",container_type="normal",host="hostname",region="dev"} 0
# HELP huatuo_bamai_netstat_container_TcpExt_TCPLossProbes statistic TcpExtTCPLossProbes.
# TYPE huatuo_bamai_netstat_container_TcpExt_TCPLossProbes gauge
huatuo_bamai_netstat_container_TcpExt_TCPLossProbes{container_host="coredns-855c4dd65d-8v5kg",container_hostnamespace="kube-system",container_level="burstable",container_name="coredns",container_type="normal",host="hostname",region="dev"} 1
# HELP huatuo_bamai_netstat_container_TcpExt_TCPLossUndo statistic TcpExtTCPLossUndo.
# TYPE huatuo_bamai_netstat_container_TcpExt_TCPLossUndo gauge
huatuo_bamai_netstat_container_TcpExt_TCPLossUndo{container_host="coredns-855c4dd65d-8v5kg",container_hostnamespace="kube-system",container_level="burstable",container_name="coredns",container_type="normal",host="hostname",region="dev"} 0
# HELP huatuo_bamai_netstat_container_TcpExt_TCPLostRetransmit statistic TcpExtTCPLostRetransmit.
# TYPE huatuo_bamai_netstat_container_TcpExt_TCPLostRetransmit gauge
huatuo_bamai_netstat_container_TcpExt_TCPLostRetransmit{container_host="coredns-855c4dd65d-8v5kg",container_hostnamespace="kube-system",container_level="burstable",container_name="coredns",container_type="normal",host="hostname",region="dev"} 0
# HELP huatuo_bamai_netstat_container_TcpExt_TCPMD5Failure statistic TcpExtTCPMD5Failure.
# TYPE huatuo_bamai_netstat_container_TcpExt_TCPMD5Failure gauge
huatuo_bamai_netstat_container_TcpExt_TCPMD5Failure{container_host="coredns-855c4dd65d-8v5kg",container_hostnamespace="kube-system",container_level="burstable",container_name="coredns",container_type="normal",host="hostname",region="dev"} 0
# HELP huatuo_bamai_netstat_container_TcpExt_TCPMD5NotFound statistic TcpExtTCPMD5NotFound.
# TYPE huatuo_bamai_netstat_container_TcpExt_TCPMD5NotFound gauge
huatuo_bamai_netstat_container_TcpExt_TCPMD5NotFound{container_host="coredns-855c4dd65d-8v5kg",container_hostnamespace="kube-system",container_level="burstable",container_name="coredns",container_type="normal",host="hostname",region="dev"} 0
# HELP huatuo_bamai_netstat_container_TcpExt_TCPMD5Unexpected statistic TcpExtTCPMD5Unexpected.
# TYPE huatuo_bamai_netstat_container_TcpExt_TCPMD5Unexpected gauge
huatuo_bamai_netstat_container_TcpExt_TCPMD5Unexpected{container_host="coredns-855c4dd65d-8v5kg",container_hostnamespace="kube-system",container_level="burstable",container_name="coredns",container_type="normal",host="hostname",region="dev"} 0
# HELP huatuo_bamai_netstat_container_TcpExt_TCPMTUPFail statistic TcpExtTCPMTUPFail.
# TYPE huatuo_bamai_netstat_container_TcpExt_TCPMTUPFail gauge
huatuo_bamai_netstat_container_TcpExt_TCPMTUPFail{container_host="coredns-855c4dd65d-8v5kg",container_hostnamespace="kube-system",container_level="burstable",container_name="coredns",container_type="normal",host="hostname",region="dev"} 0
# HELP huatuo_bamai_netstat_container_TcpExt_TCPMTUPSuccess statistic TcpExtTCPMTUPSuccess.
# TYPE huatuo_bamai_netstat_container_TcpExt_TCPMTUPSuccess gauge
huatuo_bamai_netstat_container_TcpExt_TCPMTUPSuccess{container_host="coredns-855c4dd65d-8v5kg",container_hostnamespace="kube-system",container_level="burstable",container_name="coredns",container_type="normal",host="hostname",region="dev"} 0
# HELP huatuo_bamai_netstat_container_TcpExt_TCPMemoryPressures statistic TcpExtTCPMemoryPressures.
# TYPE huatuo_bamai_netstat_container_TcpExt_TCPMemoryPressures gauge
huatuo_bamai_netstat_container_TcpExt_TCPMemoryPressures{container_host="coredns-855c4dd65d-8v5kg",container_hostnamespace="kube-system",container_level="burstable",container_name="coredns",container_type="normal",host="hostname",region="dev"} 0
# HELP huatuo_bamai_netstat_container_TcpExt_TCPMemoryPressuresChrono statistic TcpExtTCPMemoryPressuresChrono.
# TYPE huatuo_bamai_netstat_container_TcpExt_TCPMemoryPressuresChrono gauge
huatuo_bamai_netstat_container_TcpExt_TCPMemoryPressuresChrono{container_host="coredns-855c4dd65d-8v5kg",container_hostnamespace="kube-system",container_level="burstable",container_name="coredns",container_type="normal",host="hostname",region="dev"} 0
# HELP huatuo_bamai_netstat_container_TcpExt_TCPMigrateReqFailure statistic TcpExtTCPMigrateReqFailure.
# TYPE huatuo_bamai_netstat_container_TcpExt_TCPMigrateReqFailure gauge
huatuo_bamai_netstat_container_TcpExt_TCPMigrateReqFailure{container_host="coredns-855c4dd65d-8v5kg",container_hostnamespace="kube-system",container_level="burstable",container_name="coredns",container_type="normal",host="hostname",region="dev"} 0
# HELP huatuo_bamai_netstat_container_TcpExt_TCPMigrateReqSuccess statistic TcpExtTCPMigrateReqSuccess.
# TYPE huatuo_bamai_netstat_container_TcpExt_TCPMigrateReqSuccess gauge
huatuo_bamai_netstat_container_TcpExt_TCPMigrateReqSuccess{container_host="coredns-855c4dd65d-8v5kg",container_hostnamespace="kube-system",container_level="burstable",container_name="coredns",container_type="normal",host="hostname",region="dev"} 0
# HELP huatuo_bamai_netstat_container_TcpExt_TCPMinTTLDrop statistic TcpExtTCPMinTTLDrop.
# TYPE huatuo_bamai_netstat_container_TcpExt_TCPMinTTLDrop gauge
huatuo_bamai_netstat_container_TcpExt_TCPMinTTLDrop{container_host="coredns-855c4dd65d-8v5kg",container_hostnamespace="kube-system",container_level="burstable",container_name="coredns",container_type="normal",host="hostname",region="dev"} 0
# HELP huatuo_bamai_netstat_container_TcpExt_TCPOFODrop statistic TcpExtTCPOFODrop.
# TYPE huatuo_bamai_netstat_container_TcpExt_TCPOFODrop gauge
huatuo_bamai_netstat_container_TcpExt_TCPOFODrop{container_host="coredns-855c4dd65d-8v5kg",container_hostnamespace="kube-system",container_level="burstable",container_name="coredns",container_type="normal",host="hostname",region="dev"} 0
# HELP huatuo_bamai_netstat_container_TcpExt_TCPOFOMerge statistic TcpExtTCPOFOMerge.
# TYPE huatuo_bamai_netstat_container_TcpExt_TCPOFOMerge gauge
huatuo_bamai_netstat_container_TcpExt_TCPOFOMerge{container_host="coredns-855c4dd65d-8v5kg",container_hostnamespace="kube-system",container_level="burstable",container_name="coredns",container_type="normal",host="hostname",region="dev"} 0
# HELP huatuo_bamai_netstat_container_TcpExt_TCPOFOQueue statistic TcpExtTCPOFOQueue.
# TYPE huatuo_bamai_netstat_container_TcpExt_TCPOFOQueue gauge
huatuo_bamai_netstat_container_TcpExt_TCPOFOQueue{container_host="coredns-855c4dd65d-8v5kg",container_hostnamespace="kube-system",container_level="burstable",container_name="coredns",container_type="normal",host="hostname",region="dev"} 0
# HELP huatuo_bamai_netstat_container_TcpExt_TCPOrigDataSent statistic TcpExtTCPOrigDataSent.
# TYPE huatuo_bamai_netstat_container_TcpExt_TCPOrigDataSent gauge
huatuo_bamai_netstat_container_TcpExt_TCPOrigDataSent{container_host="coredns-855c4dd65d-8v5kg",container_hostnamespace="kube-system",container_level="burstable",container_name="coredns",container_type="normal",host="hostname",region="dev"} 2.675557e+06
# HELP huatuo_bamai_netstat_container_TcpExt_TCPPLBRehash statistic TcpExtTCPPLBRehash.
# TYPE huatuo_bamai_netstat_container_TcpExt_TCPPLBRehash gauge
huatuo_bamai_netstat_container_TcpExt_TCPPLBRehash{container_host="coredns-855c4dd65d-8v5kg",container_hostnamespace="kube-system",container_level="burstable",container_name="coredns",container_type="normal",host="hostname",region="dev"} 0
# HELP huatuo_bamai_netstat_container_TcpExt_TCPPartialUndo statistic TcpExtTCPPartialUndo.
# TYPE huatuo_bamai_netstat_container_TcpExt_TCPPartialUndo gauge
huatuo_bamai_netstat_container_TcpExt_TCPPartialUndo{container_host="coredns-855c4dd65d-8v5kg",container_hostnamespace="kube-system",container_level="burstable",container_name="coredns",container_type="normal",host="hostname",region="dev"} 0
# HELP huatuo_bamai_netstat_container_TcpExt_TCPPureAcks statistic TcpExtTCPPureAcks.
# TYPE huatuo_bamai_netstat_container_TcpExt_TCPPureAcks gauge
huatuo_bamai_netstat_container_TcpExt_TCPPureAcks{container_host="coredns-855c4dd65d-8v5kg",container_hostnamespace="kube-system",container_level="burstable",container_name="coredns",container_type="normal",host="hostname",region="dev"} 2.095262e+06
# HELP huatuo_bamai_netstat_container_TcpExt_TCPRcvCoalesce statistic TcpExtTCPRcvCoalesce.
# TYPE huatuo_bamai_netstat_container_TcpExt_TCPRcvCoalesce gauge
huatuo_bamai_netstat_container_TcpExt_TCPRcvCoalesce{container_host="coredns-855c4dd65d-8v5kg",container_hostnamespace="kube-system",container_level="burstable",container_name="coredns",container_type="normal",host="hostname",region="dev"} 3
# HELP huatuo_bamai_netstat_container_TcpExt_TCPRcvCollapsed statistic TcpExtTCPRcvCollapsed.
# TYPE huatuo_bamai_netstat_container_TcpExt_TCPRcvCollapsed gauge
huatuo_bamai_netstat_container_TcpExt_TCPRcvCollapsed{container_host="coredns-855c4dd65d-8v5kg",container_hostnamespace="kube-system",container_level="burstable",container_name="coredns",container_type="normal",host="hostname",region="dev"} 0
# HELP huatuo_bamai_netstat_container_TcpExt_TCPRcvQDrop statistic TcpExtTCPRcvQDrop.
# TYPE huatuo_bamai_netstat_container_TcpExt_TCPRcvQDrop gauge
huatuo_bamai_netstat_container_TcpExt_TCPRcvQDrop{container_host="coredns-855c4dd65d-8v5kg",container_hostnamespace="kube-system",container_level="burstable",container_name="coredns",container_type="normal",host="hostname",region="dev"} 0
# HELP huatuo_bamai_netstat_container_TcpExt_TCPRenoFailures statistic TcpExtTCPRenoFailures.
# TYPE huatuo_bamai_netstat_container_TcpExt_TCPRenoFailures gauge
huatuo_bamai_netstat_container_TcpExt_TCPRenoFailures{container_host="coredns-855c4dd65d-8v5kg",container_hostnamespace="kube-system",container_level="burstable",container_name="coredns",container_type="normal",host="hostname",region="dev"} 0
# HELP huatuo_bamai_netstat_container_TcpExt_TCPRenoRecovery statistic TcpExtTCPRenoRecovery.
# TYPE huatuo_bamai_netstat_container_TcpExt_TCPRenoRecovery gauge
huatuo_bamai_netstat_container_TcpExt_TCPRenoRecovery{container_host="coredns-855c4dd65d-8v5kg",container_hostnamespace="kube-system",container_level="burstable",container_name="coredns",container_type="normal",host="hostname",region="dev"} 0
# HELP huatuo_bamai_netstat_container_TcpExt_TCPRenoRecoveryFail statistic TcpExtTCPRenoRecoveryFail.
# TYPE huatuo_bamai_netstat_container_TcpExt_TCPRenoRecoveryFail gauge
huatuo_bamai_netstat_container_TcpExt_TCPRenoRecoveryFail{container_host="coredns-855c4dd65d-8v5kg",container_hostnamespace="kube-system",container_level="burstable",container_name="coredns",container_type="normal",host="hostname",region="dev"} 0
# HELP huatuo_bamai_netstat_container_TcpExt_TCPRenoReorder statistic TcpExtTCPRenoReorder.
# TYPE huatuo_bamai_netstat_container_TcpExt_TCPRenoReorder gauge
huatuo_bamai_netstat_container_TcpExt_TCPRenoReorder{container_host="coredns-855c4dd65d-8v5kg",container_hostnamespace="kube-system",container_level="burstable",container_name="coredns",container_type="normal",host="hostname",region="dev"} 0
# HELP huatuo_bamai_netstat_container_TcpExt_TCPReqQFullDoCookies statistic TcpExtTCPReqQFullDoCookies.
# TYPE huatuo_bamai_netstat_container_TcpExt_TCPReqQFullDoCookies gauge
huatuo_bamai_netstat_container_TcpExt_TCPReqQFullDoCookies{container_host="coredns-855c4dd65d-8v5kg",container_hostnamespace="kube-system",container_level="burstable",container_name="coredns",container_type="normal",host="hostname",region="dev"} 0
# HELP huatuo_bamai_netstat_container_TcpExt_TCPReqQFullDrop statistic TcpExtTCPReqQFullDrop.
# TYPE huatuo_bamai_netstat_container_TcpExt_TCPReqQFullDrop gauge
huatuo_bamai_netstat_container_TcpExt_TCPReqQFullDrop{container_host="coredns-855c4dd65d-8v5kg",container_hostnamespace="kube-system",container_level="burstable",container_name="coredns",container_type="normal",host="hostname",region="dev"} 0
# HELP huatuo_bamai_netstat_container_TcpExt_TCPRetransFail statistic TcpExtTCPRetransFail.
# TYPE huatuo_bamai_netstat_container_TcpExt_TCPRetransFail gauge
huatuo_bamai_netstat_container_TcpExt_TCPRetransFail{container_host="coredns-855c4dd65d-8v5kg",container_hostnamespace="kube-system",container_level="burstable",container_name="coredns",container_type="normal",host="hostname",region="dev"} 0
# HELP huatuo_bamai_netstat_container_TcpExt_TCPSACKDiscard statistic TcpExtTCPSACKDiscard.
# TYPE huatuo_bamai_netstat_container_TcpExt_TCPSACKDiscard gauge
huatuo_bamai_netstat_container_TcpExt_TCPSACKDiscard{container_host="coredns-855c4dd65d-8v5kg",container_hostnamespace="kube-system",container_level="burstable",container_name="coredns",container_type="normal",host="hostname",region="dev"} 0
# HELP huatuo_bamai_netstat_container_TcpExt_TCPSACKReneging statistic TcpExtTCPSACKReneging.
# TYPE huatuo_bamai_netstat_container_TcpExt_TCPSACKReneging gauge
huatuo_bamai_netstat_container_TcpExt_TCPSACKReneging{container_host="coredns-855c4dd65d-8v5kg",container_hostnamespace="kube-system",container_level="burstable",container_name="coredns",container_type="normal",host="hostname",region="dev"} 0
# HELP huatuo_bamai_netstat_container_TcpExt_TCPSACKReorder statistic TcpExtTCPSACKReorder.
# TYPE huatuo_bamai_netstat_container_TcpExt_TCPSACKReorder gauge
huatuo_bamai_netstat_container_TcpExt_TCPSACKReorder{container_host="coredns-855c4dd65d-8v5kg",container_hostnamespace="kube-system",container_level="burstable",container_name="coredns",container_type="normal",host="hostname",region="dev"} 0
# HELP huatuo_bamai_netstat_container_TcpExt_TCPSYNChallenge statistic TcpExtTCPSYNChallenge.
# TYPE huatuo_bamai_netstat_container_TcpExt_TCPSYNChallenge gauge
huatuo_bamai_netstat_container_TcpExt_TCPSYNChallenge{container_host="coredns-855c4dd65d-8v5kg",container_hostnamespace="kube-system",container_level="burstable",container_name="coredns",container_type="normal",host="hostname",region="dev"} 0
# HELP huatuo_bamai_netstat_container_TcpExt_TCPSackFailures statistic TcpExtTCPSackFailures.
# TYPE huatuo_bamai_netstat_container_TcpExt_TCPSackFailures gauge
huatuo_bamai_netstat_container_TcpExt_TCPSackFailures{container_host="coredns-855c4dd65d-8v5kg",container_hostnamespace="kube-system",container_level="burstable",container_name="coredns",container_type="normal",host="hostname",region="dev"} 0
# HELP huatuo_bamai_netstat_container_TcpExt_TCPSackMerged statistic TcpExtTCPSackMerged.
# TYPE huatuo_bamai_netstat_container_TcpExt_TCPSackMerged gauge
huatuo_bamai_netstat_container_TcpExt_TCPSackMerged{container_host="coredns-855c4dd65d-8v5kg",container_hostnamespace="kube-system",container_level="burstable",container_name="coredns",container_type="normal",host="hostname",region="dev"} 0
# HELP huatuo_bamai_netstat_container_TcpExt_TCPSackRecovery statistic TcpExtTCPSackRecovery.
# TYPE huatuo_bamai_netstat_container_TcpExt_TCPSackRecovery gauge
huatuo_bamai_netstat_container_TcpExt_TCPSackRecovery{container_host="coredns-855c4dd65d-8v5kg",container_hostnamespace="kube-system",container_level="burstable",container_name="coredns",container_type="normal",host="hostname",region="dev"} 0
# HELP huatuo_bamai_netstat_container_TcpExt_TCPSackRecoveryFail statistic TcpExtTCPSackRecoveryFail.
# TYPE huatuo_bamai_netstat_container_TcpExt_TCPSackRecoveryFail gauge
huatuo_bamai_netstat_container_TcpExt_TCPSackRecoveryFail{container_host="coredns-855c4dd65d-8v5kg",container_hostnamespace="kube-system",container_level="burstable",container_name="coredns",container_type="normal",host="hostname",region="dev"} 0
# HELP huatuo_bamai_netstat_container_TcpExt_TCPSackShiftFallback statistic TcpExtTCPSackShiftFallback.
# TYPE huatuo_bamai_netstat_container_TcpExt_TCPSackShiftFallback gauge
huatuo_bamai_netstat_container_TcpExt_TCPSackShiftFallback{container_host="coredns-855c4dd65d-8v5kg",container_hostnamespace="kube-system",container_level="burstable",container_name="coredns",container_type="normal",host="hostname",region="dev"} 0
# HELP huatuo_bamai_netstat_container_TcpExt_TCPSackShifted statistic TcpExtTCPSackShifted.
# TYPE huatuo_bamai_netstat_container_TcpExt_TCPSackShifted gauge
huatuo_bamai_netstat_container_TcpExt_TCPSackShifted{container_host="coredns-855c4dd65d-8v5kg",container_hostnamespace="kube-system",container_level="burstable",container_name="coredns",container_type="normal",host="hostname",region="dev"} 0
# HELP huatuo_bamai_netstat_container_TcpExt_TCPSlowStartRetrans statistic TcpExtTCPSlowStartRetrans.
# TYPE huatuo_bamai_netstat_container_TcpExt_TCPSlowStartRetrans gauge
huatuo_bamai_netstat_container_TcpExt_TCPSlowStartRetrans{container_host="coredns-855c4dd65d-8v5kg",container_hostnamespace="kube-system",container_level="burstable",container_name="coredns",container_type="normal",host="hostname",region="dev"} 0
# HELP huatuo_bamai_netstat_container_TcpExt_TCPSpuriousRTOs statistic TcpExtTCPSpuriousRTOs.
# TYPE huatuo_bamai_netstat_container_TcpExt_TCPSpuriousRTOs gauge
huatuo_bamai_netstat_container_TcpExt_TCPSpuriousRTOs{container_host="coredns-855c4dd65d-8v5kg",container_hostnamespace="kube-system",container_level="burstable",container_name="coredns",container_type="normal",host="hostname",region="dev"} 0
# HELP huatuo_bamai_netstat_container_TcpExt_TCPSpuriousRtxHostQueues statistic TcpExtTCPSpuriousRtxHostQueues.
# TYPE huatuo_bamai_netstat_container_TcpExt_TCPSpuriousRtxHostQueues gauge
huatuo_bamai_netstat_container_TcpExt_TCPSpuriousRtxHostQueues{container_host="coredns-855c4dd65d-8v5kg",container_hostnamespace="kube-system",container_level="burstable",container_name="coredns",container_type="normal",host="hostname",region="dev"} 0
# HELP huatuo_bamai_netstat_container_TcpExt_TCPSynRetrans statistic TcpExtTCPSynRetrans.
# TYPE huatuo_bamai_netstat_container_TcpExt_TCPSynRetrans gauge
huatuo_bamai_netstat_container_TcpExt_TCPSynRetrans{container_host="coredns-855c4dd65d-8v5kg",container_hostnamespace="kube-system",container_level="burstable",container_name="coredns",container_type="normal",host="hostname",region="dev"} 0
# HELP huatuo_bamai_netstat_container_TcpExt_TCPTSReorder statistic TcpExtTCPTSReorder.
# TYPE huatuo_bamai_netstat_container_TcpExt_TCPTSReorder gauge
huatuo_bamai_netstat_container_TcpExt_TCPTSReorder{container_host="coredns-855c4dd65d-8v5kg",container_hostnamespace="kube-system",container_level="burstable",container_name="coredns",container_type="normal",host="hostname",region="dev"} 0
# HELP huatuo_bamai_netstat_container_TcpExt_TCPTimeWaitOverflow statistic TcpExtTCPTimeWaitOverflow.
# TYPE huatuo_bamai_netstat_container_TcpExt_TCPTimeWaitOverflow gauge
huatuo_bamai_netstat_container_TcpExt_TCPTimeWaitOverflow{container_host="coredns-855c4dd65d-8v5kg",container_hostnamespace="kube-system",container_level="burstable",container_name="coredns",container_type="normal",host="hostname",region="dev"} 0
# HELP huatuo_bamai_netstat_container_TcpExt_TCPTimeouts statistic TcpExtTCPTimeouts.
# TYPE huatuo_bamai_netstat_container_TcpExt_TCPTimeouts gauge
huatuo_bamai_netstat_container_TcpExt_TCPTimeouts{container_host="coredns-855c4dd65d-8v5kg",container_hostnamespace="kube-system",container_level="burstable",container_name="coredns",container_type="normal",host="hostname",region="dev"} 0
# HELP huatuo_bamai_netstat_container_TcpExt_TCPToZeroWindowAdv statistic TcpExtTCPToZeroWindowAdv.
# TYPE huatuo_bamai_netstat_container_TcpExt_TCPToZeroWindowAdv gauge
huatuo_bamai_netstat_container_TcpExt_TCPToZeroWindowAdv{container_host="coredns-855c4dd65d-8v5kg",container_hostnamespace="kube-system",container_level="burstable",container_name="coredns",container_type="normal",host="hostname",region="dev"} 0
# HELP huatuo_bamai_netstat_container_TcpExt_TCPWantZeroWindowAdv statistic TcpExtTCPWantZeroWindowAdv.
# TYPE huatuo_bamai_netstat_container_TcpExt_TCPWantZeroWindowAdv gauge
huatuo_bamai_netstat_container_TcpExt_TCPWantZeroWindowAdv{container_host="coredns-855c4dd65d-8v5kg",container_hostnamespace="kube-system",container_level="burstable",container_name="coredns",container_type="normal",host="hostname",region="dev"} 0
# HELP huatuo_bamai_netstat_container_TcpExt_TCPWinProbe statistic TcpExtTCPWinProbe.
# TYPE huatuo_bamai_netstat_container_TcpExt_TCPWinProbe gauge
huatuo_bamai_netstat_container_TcpExt_TCPWinProbe{container_host="coredns-855c4dd65d-8v5kg",container_hostnamespace="kube-system",container_level="burstable",container_name="coredns",container_type="normal",host="hostname",region="dev"} 0
# HELP huatuo_bamai_netstat_container_TcpExt_TCPWqueueTooBig statistic TcpExtTCPWqueueTooBig.
# TYPE huatuo_bamai_netstat_container_TcpExt_TCPWqueueTooBig gauge
huatuo_bamai_netstat_container_TcpExt_TCPWqueueTooBig{container_host="coredns-855c4dd65d-8v5kg",container_hostnamespace="kube-system",container_level="burstable",container_name="coredns",container_type="normal",host="hostname",region="dev"} 0
# HELP huatuo_bamai_netstat_container_TcpExt_TCPZeroWindowDrop statistic TcpExtTCPZeroWindowDrop.
# TYPE huatuo_bamai_netstat_container_TcpExt_TCPZeroWindowDrop gauge
huatuo_bamai_netstat_container_TcpExt_TCPZeroWindowDrop{container_host="coredns-855c4dd65d-8v5kg",container_hostnamespace="kube-system",container_level="burstable",container_name="coredns",container_type="normal",host="hostname",region="dev"} 0
# HELP huatuo_bamai_netstat_container_TcpExt_TW statistic TcpExtTW.
# TYPE huatuo_bamai_netstat_container_TcpExt_TW gauge
huatuo_bamai_netstat_container_TcpExt_TW{container_host="coredns-855c4dd65d-8v5kg",container_hostnamespace="kube-system",container_level="burstable",container_name="coredns",container_type="normal",host="hostname",region="dev"} 720624
# HELP huatuo_bamai_netstat_container_TcpExt_TWKilled statistic TcpExtTWKilled.
# TYPE huatuo_bamai_netstat_container_TcpExt_TWKilled gauge
huatuo_bamai_netstat_container_TcpExt_TWKilled{container_host="coredns-855c4dd65d-8v5kg",container_hostnamespace="kube-system",container_level="burstable",container_name="coredns",container_type="normal",host="hostname",region="dev"} 0
# HELP huatuo_bamai_netstat_container_TcpExt_TWRecycled statistic TcpExtTWRecycled.
# TYPE huatuo_bamai_netstat_container_TcpExt_TWRecycled gauge
huatuo_bamai_netstat_container_TcpExt_TWRecycled{container_host="coredns-855c4dd65d-8v5kg",container_hostnamespace="kube-system",container_level="burstable",container_name="coredns",container_type="normal",host="hostname",region="dev"} 2461
# HELP huatuo_bamai_netstat_container_TcpExt_TcpDuplicateDataRehash statistic TcpExtTcpDuplicateDataRehash.
# TYPE huatuo_bamai_netstat_container_TcpExt_TcpDuplicateDataRehash gauge
huatuo_bamai_netstat_container_TcpExt_TcpDuplicateDataRehash{container_host="coredns-855c4dd65d-8v5kg",container_hostnamespace="kube-system",container_level="burstable",container_name="coredns",container_type="normal",host="hostname",region="dev"} 0
# HELP huatuo_bamai_netstat_container_TcpExt_TcpTimeoutRehash statistic TcpExtTcpTimeoutRehash.
# TYPE huatuo_bamai_netstat_container_TcpExt_TcpTimeoutRehash gauge
huatuo_bamai_netstat_container_TcpExt_TcpTimeoutRehash{container_host="coredns-855c4dd65d-8v5kg",container_hostnamespace="kube-system",container_level="burstable",container_name="coredns",container_type="normal",host="hostname",region="dev"} 0
| 指标 |
意义 |
单位 |
对象 |
标签 |
| netstat_TcpExt_ArpFilter |
因 ARP 过滤规则而被丢弃的数据包数量 |
计数 |
宿主,容器 |
container_host, container_hostnamespace, container_level, container_name, container_type, host, region |
| netstat_TcpExt_BusyPollRxPackets |
通过 busy polling 机制接收到的数据包数量 |
计数 |
宿主,容器 |
container_host, container_hostnamespace, container_level, container_name, container_type, host, region |
| netstat_TcpExt_DelayedACKLocked |
由于用户态进程锁住了 socket,而无法发送 delayed ACK 的次数 |
计数 |
宿主,容器 |
container_host, container_hostnamespace, container_level, container_name, container_type, host, region |
| netstat_TcpExt_DelayedACKLost |
延迟 ACK 丢失导致重传的次数 |
计数 |
宿主,容器 |
container_host, container_hostnamespace, container_level, container_name, container_type, host, region |
| netstat_TcpExt_DelayedACKs |
尝试发送 delayed ACK 的次数,包括未成功发送的次数 |
计数 |
宿主,容器 |
container_host, container_hostnamespace, container_level, container_name, container_type, host, region |
| netstat_TcpExt_EmbryonicRsts |
在 SYN_RECV 状态收到带 RST/SYN 标记的包个数 |
计数 |
宿主,容器 |
container_host, container_hostnamespace, container_level, container_name, container_type, host, region |
| netstat_TcpExt_ListenDrops |
因全连接队列满丢弃的连接总数(含ListenOverflows) |
计数 |
宿主,容器 |
container_host, container_hostnamespace, container_level, container_name, container_type, host, region |
| netstat_TcpExt_ListenOverflows |
表示在 TCP 监听队列中发生的溢出次数 |
计数 |
宿主,容器 |
container_host, container_hostnamespace, container_level, container_name, container_type, host, region |
| netstat_TcpExt_OfoPruned |
乱序队列因内存不足被修剪的次数 |
计数 |
宿主,容器 |
container_host, container_hostnamespace, container_level, container_name, container_type, host, region |
| netstat_TcpExt_OutOfWindowIcmps |
收到的与当前 TCP 窗口无关的 ICMP 错误报文数量 |
计数 |
宿主,容器 |
container_host, container_hostnamespace, container_level, container_name, container_type, host, region |
| netstat_TcpExt_PruneCalled |
因内存不足触发缓存清理的次数 |
计数 |
宿主,容器 |
container_host, container_hostnamespace, container_level, container_name, container_type, host, region |
| netstat_TcpExt_RcvPruned |
接收队列因内存不足被修剪(丢弃数据包)的次数 |
计数 |
宿主,容器 |
container_host, container_hostnamespace, container_level, container_name, container_type, host, region |
| netstat_TcpExt_SyncookiesFailed |
验证失败的 SYN cookie 数量 |
计数 |
宿主,容器 |
container_host, container_hostnamespace, container_level, container_name, container_type, host, region |
| netstat_TcpExt_SyncookiesRecv |
表示接收的 SYN cookie 的数量 |
计数 |
宿主,容器 |
container_host, container_hostnamespace, container_level, container_name, container_type, host, region |
| netstat_TcpExt_SyncookiesSent |
表示发送的 SYN cookie 的数量 |
计数 |
宿主,容器 |
container_host, container_hostnamespace, container_level, container_name, container_type, host, region |
| netstat_TcpExt_TCPACKSkippedChallenge |
在处理 Challenge ACK 过程中跳过的其他 ACK 数量 |
计数 |
宿主,容器 |
container_host, container_hostnamespace, container_level, container_name, container_type, host, region |
| netstat_TcpExt_TCPACKSkippedFinWait2 |
在 FIN-WAIT-2 状态下跳过的 ACK 数量 |
计数 |
宿主,容器 |
container_host, container_hostnamespace, container_level, container_name, container_type, host, region |
| netstat_TcpExt_TCPACKSkippedPAWS |
因 PAWS 检查失败而跳过的 ACK 数量 |
计数 |
宿主,容器 |
container_host, container_hostnamespace, container_level, container_name, container_type, host, region |
| netstat_TcpExt_TCPACKSkippedSeq |
因为序列号检查而跳过的 ACK 数量 |
计数 |
宿主,容器 |
container_host, container_hostnamespace, container_level, container_name, container_type, host, region |
| netstat_TcpExt_TCPACKSkippedTimeWait |
在 TIME-WAIT 状态下跳过的 ACK 数量 |
计数 |
宿主,容器 |
container_host, container_hostnamespace, container_level, container_name, container_type, host, region |
| netstat_TcpExt_TCPAbortOnClose |
用户态程序在缓冲区内还有数据时关闭连接的次数 |
计数 |
宿主,容器 |
container_host, container_hostnamespace, container_level, container_name, container_type, host, region |
| netstat_TcpExt_TCPAbortOnData |
收到未知数据导致被关闭的次数 |
计数 |
宿主,容器 |
container_host, container_hostnamespace, container_level, container_name, container_type, host, region |
| netstat_TcpExt_TCPAbortOnLinger |
在LINGER状态下等待超时后中止连接的数量 |
计数 |
宿主,容器 |
container_host, container_hostnamespace, container_level, container_name, container_type, host, region |
| netstat_TcpExt_TCPAbortOnMemory |
因内存问题关闭连接的次数 |
计数 |
宿主,容器 |
container_host, container_hostnamespace, container_level, container_name, container_type, host, region |
| netstat_TcpExt_TCPAbortOnTimeout |
因各种计时器的重传次数超过上限而关闭连接的次数 |
计数 |
宿主,容器 |
container_host, container_hostnamespace, container_level, container_name, container_type, host, region |
| netstat_TcpExt_TCPLossFailures |
丢失数据包而进行恢复失败的次数 |
计数 |
宿主,容器 |
container_host, container_hostnamespace, container_level, container_name, container_type, host, region |
| netstat_TcpExt_TCPLossProbeRecovery |
检测到丢失的数据包恢复的次数 |
计数 |
宿主,容器 |
container_host, container_hostnamespace, container_level, container_name, container_type, host, region |
| netstat_TcpExt_TCPLossProbes |
TCP 检测到丢失的数据包数量,通常用于检测网络拥塞或丢包 |
计数 |
宿主,容器 |
container_host, container_hostnamespace, container_level, container_name, container_type, host, region |
| netstat_TcpExt_TCPLossUndo |
在恢复过程中检测到丢失而撤销的次数 |
计数 |
宿主,容器 |
container_host, container_hostnamespace, container_level, container_name, container_type, host, region |
| netstat_TcpExt_TCPLostRetransmit |
丢包重传的数量 |
计数 |
宿主,容器 |
container_host, container_hostnamespace, container_level, container_name, container_type, host, region |
备注:TcpExt 扩展指标非常多,可按需参考官方文档。
Ref:
Socket
# HELP huatuo_bamai_sockstat_container_FRAG_inuse Number of FRAG sockets in state inuse.
# TYPE huatuo_bamai_sockstat_container_FRAG_inuse gauge
huatuo_bamai_sockstat_container_FRAG_inuse{container_host="coredns-855c4dd65d-8v5kg",container_hostnamespace="kube-system",container_level="burstable",container_name="coredns",container_type="normal",host="hostname",region="dev"} 0
# HELP huatuo_bamai_sockstat_container_FRAG_memory Number of FRAG sockets in state memory.
# TYPE huatuo_bamai_sockstat_container_FRAG_memory gauge
huatuo_bamai_sockstat_container_FRAG_memory{container_host="coredns-855c4dd65d-8v5kg",container_hostnamespace="kube-system",container_level="burstable",container_name="coredns",container_type="normal",host="hostname",region="dev"} 0
# HELP huatuo_bamai_sockstat_container_RAW_inuse Number of RAW sockets in state inuse.
# TYPE huatuo_bamai_sockstat_container_RAW_inuse gauge
huatuo_bamai_sockstat_container_RAW_inuse{container_host="coredns-855c4dd65d-8v5kg",container_hostnamespace="kube-system",container_level="burstable",container_name="coredns",container_type="normal",host="hostname",region="dev"} 0
# HELP huatuo_bamai_sockstat_container_TCP_alloc Number of TCP sockets in state alloc.
# TYPE huatuo_bamai_sockstat_container_TCP_alloc gauge
huatuo_bamai_sockstat_container_TCP_alloc{container_host="coredns-855c4dd65d-8v5kg",container_hostnamespace="kube-system",container_level="burstable",container_name="coredns",container_type="normal",host="hostname",region="dev"} 171
# HELP huatuo_bamai_sockstat_container_TCP_inuse Number of TCP sockets in state inuse.
# TYPE huatuo_bamai_sockstat_container_TCP_inuse gauge
huatuo_bamai_sockstat_container_TCP_inuse{container_host="coredns-855c4dd65d-8v5kg",container_hostnamespace="kube-system",container_level="burstable",container_name="coredns",container_type="normal",host="hostname",region="dev"} 1
# HELP huatuo_bamai_sockstat_container_TCP_orphan Number of TCP sockets in state orphan.
# TYPE huatuo_bamai_sockstat_container_TCP_orphan gauge
huatuo_bamai_sockstat_container_TCP_orphan{container_host="coredns-855c4dd65d-8v5kg",container_hostnamespace="kube-system",container_level="burstable",container_name="coredns",container_type="normal",host="hostname",region="dev"} 0
# HELP huatuo_bamai_sockstat_container_TCP_tw Number of TCP sockets in state tw.
# TYPE huatuo_bamai_sockstat_container_TCP_tw gauge
huatuo_bamai_sockstat_container_TCP_tw{container_host="coredns-855c4dd65d-8v5kg",container_hostnamespace="kube-system",container_level="burstable",container_name="coredns",container_type="normal",host="hostname",region="dev"} 75
# HELP huatuo_bamai_sockstat_container_UDPLITE_inuse Number of UDPLITE sockets in state inuse.
# TYPE huatuo_bamai_sockstat_container_UDPLITE_inuse gauge
huatuo_bamai_sockstat_container_UDPLITE_inuse{container_host="coredns-855c4dd65d-8v5kg",container_hostnamespace="kube-system",container_level="burstable",container_name="coredns",container_type="normal",host="hostname",region="dev"} 0
# HELP huatuo_bamai_sockstat_container_UDP_inuse Number of UDP sockets in state inuse.
# TYPE huatuo_bamai_sockstat_container_UDP_inuse gauge
huatuo_bamai_sockstat_container_UDP_inuse{container_host="coredns-855c4dd65d-8v5kg",container_hostnamespace="kube-system",container_level="burstable",container_name="coredns",container_type="normal",host="hostname",region="dev"} 0
# HELP huatuo_bamai_sockstat_container_sockets_used Number of IPv4 sockets in use.
# TYPE huatuo_bamai_sockstat_container_sockets_used gauge
huatuo_bamai_sockstat_container_sockets_used{container_host="coredns-855c4dd65d-8v5kg",container_hostnamespace="kube-system",container_level="burstable",container_name="coredns",container_type="normal",host="hostname",region="dev"} 7
# HELP huatuo_bamai_sockstat_sockets_used Number of IPv4 sockets in use.
# TYPE huatuo_bamai_sockstat_sockets_used gauge
huatuo_bamai_sockstat_sockets_used{host="hostname",region="dev"} 409
| 指标 |
意义 |
单位 |
对象 |
标签 |
| sockstat_sockets_used |
系统层面当前正在使用的 socket 描述符总数 |
计数 |
系统 |
|
| sockstat_TCP_inuse |
当前处于 TCP 连接状态(如 ESTABLISHED、LISTEN 等,除 TIME_WAIT 外)的 socket 数量 |
计数 |
宿主,容器 |
|
| sockstat_TCP_orphan |
通常表示应用已关闭但 TCP 连接仍未结束 |
计数 |
宿主,容器 |
|
| sockstat_TCP_tw |
当前处于 TIME_WAIT 状态的 TCP socket 数量 |
计数 |
宿主,容器 |
|
| sockstat_TCP_alloc |
当前已分配的 TCP socket 对象总数 |
计数 |
宿主,容器 |
|
| sockstat_TCP_mem |
TCP 套接字当前占用的内核内存页数 |
内存页 |
系统 |
|
| sockstat_UDP_inuse |
当前已绑定了本地端口的 UDP socket 数量 |
计数 |
宿主,容器 |
|
IO
iolatency 用来统计磁盘 I/O 延迟分布。可以把它理解成“把一次磁盘请求拆成几个阶段,再分别看每个阶段耗时多久”。
q2c:从请求进入队列到完成,反映整个 I/O 生命周期延迟d2c:从驱动层下发到完成,更接近磁盘和驱动本身的耗时freeze:磁盘冻结事件次数
队列
这些指标都会自动带上公共标签 host 和 region。其中容器维度指标还会固定带上
container_host、container_name、container_type、container_level、container_hostnamespace 标签。
# HELP huatuo_bamai_iolatency_blkdisk_d2c the disk d2c latency
# TYPE huatuo_bamai_iolatency_blkdisk_d2c gauge
huatuo_bamai_iolatency_blkdisk_d2c{disk="253:1",host="hostname",region="dev",zone="0"} 3
# HELP huatuo_bamai_iolatency_blkdisk_q2c the disk q2c latency
# TYPE huatuo_bamai_iolatency_blkdisk_q2c gauge
huatuo_bamai_iolatency_blkdisk_q2c{disk="253:1",host="hostname",region="dev",zone="0"} 3
# HELP huatuo_bamai_iolatency_container_blkdisk_d2c container blkio d2c latency
# TYPE huatuo_bamai_iolatency_container_blkdisk_d2c gauge
huatuo_bamai_iolatency_container_blkdisk_d2c{container_host="etcd-hostname",container_hostnamespace="kube-system",container_level="burstable",container_name="etcd",container_type="normal",disk="253:1",host="hostname",region="dev",zone="5"} 2
# HELP huatuo_bamai_iolatency_container_blkdisk_q2c container blkio q2c latency
# TYPE huatuo_bamai_iolatency_container_blkdisk_q2c gauge
huatuo_bamai_iolatency_container_blkdisk_q2c{container_host="etcd-hostname",container_hostnamespace="kube-system",container_level="burstable",container_name="etcd",container_type="normal",disk="253:1",host="hostname",region="dev",zone="5"} 2
| 指标 |
意义 |
单位 |
对象 |
标签 |
| iolatency_blkdisk_q2c |
宿主机磁盘整体 I/O 生命周期延迟统计,从入队到完成。分桶为:zone0 20-30ms,zone1 30-50ms,zone2 50-100ms,zone3 100-200ms,zone4 200-400ms,zone5 400ms+ |
计数 |
宿主 |
host, region, disk, zone |
| iolatency_blkdisk_d2c |
宿主机磁盘驱动到完成阶段的延迟统计,更接近设备处理耗时。分桶为:zone0 20-30ms,zone1 30-50ms,zone2 50-100ms,zone3 100-200ms,zone4 200-400ms,zone5 400ms+ |
计数 |
宿主 |
host, region, disk, zone |
| iolatency_container_blkdisk_q2c |
容器触发的整体 I/O 生命周期延迟统计,从入队到完成。分桶为:zone0 20-30ms,zone1 30-50ms,zone2 50-100ms,zone3 100-200ms,zone4 200-400ms,zone5 400ms+ |
计数 |
容器 |
host, region, container_host, container_name, container_type, container_level, container_hostnamespace, zone |
| iolatency_container_blkdisk_d2c |
容器触发的驱动到完成阶段延迟统计。分桶为:zone0 20-30ms,zone1 30-50ms,zone2 50-100ms,zone3 100-200ms,zone4 200-400ms,zone5 400ms+ |
计数 |
容器 |
host, region, container_host, container_name, container_type, container_level, container_hostnamespace, zone |
硬件
# HELP huatuo_bamai_iolatency_blkdisk_freeze the disk freeze event count
# TYPE huatuo_bamai_iolatency_blkdisk_freeze gauge
huatuo_bamai_iolatency_blkdisk_freeze{disk="253:1",host="hostname",region="dev"} 0
| 指标 |
意义 |
单位 |
对象 |
标签 |
| iolatency_blkdisk_freeze |
宿主机磁盘 freeze 事件次数 |
计数 |
宿主 |
host, region, disk |
磁盘 IO 统计
diskio 通过读取 /proc/diskstats 和 /proc/stat 采集 per-device 磁盘 IO 指标和系统级 CPU iowait。与 iolatency 不同,diskio 基于 procfs 而非 eBPF,提供可通过 rate 计算延迟的累积计数器。
默认配置通过 BlackList 禁用该 collector。需要启用这些指标时,从
BlackList 中移除 diskio。
Counter 指标为累积值,需使用 Prometheus rate() 计算 per-second 值(IOPS、吞吐量)。Gauge 指标为瞬时值。平均延迟通过 PromQL 中的 I/O 时间 rate 除以请求 rate 计算。
# HELP huatuo_bamai_diskio_read_requests_total Total number of read requests completed successfully.
# TYPE huatuo_bamai_diskio_read_requests_total counter
huatuo_bamai_diskio_read_requests_total{device="sda",host="hostname",region="dev"} 1000
# HELP huatuo_bamai_diskio_write_requests_total Total number of write requests completed successfully.
# TYPE huatuo_bamai_diskio_write_requests_total counter
huatuo_bamai_diskio_write_requests_total{device="sda",host="hostname",region="dev"} 2000
# HELP huatuo_bamai_diskio_read_bytes_total Total number of bytes read from the device.
# TYPE huatuo_bamai_diskio_read_bytes_total counter
huatuo_bamai_diskio_read_bytes_total{device="sda",host="hostname",region="dev"} 2.56e+07
# HELP huatuo_bamai_diskio_written_bytes_total Total number of bytes written to the device.
# TYPE huatuo_bamai_diskio_written_bytes_total counter
huatuo_bamai_diskio_written_bytes_total{device="sda",host="hostname",region="dev"} 4.096e+07
# HELP huatuo_bamai_diskio_io_in_progress Number of I/O requests currently in flight (queue depth).
# TYPE huatuo_bamai_diskio_io_in_progress gauge
huatuo_bamai_diskio_io_in_progress{device="sda",host="hostname",region="dev"} 50
# HELP huatuo_bamai_diskio_read_time_seconds_total Total seconds spent by completed read requests.
# TYPE huatuo_bamai_diskio_read_time_seconds_total counter
huatuo_bamai_diskio_read_time_seconds_total{device="sda",host="hostname",region="dev"} 3
# HELP huatuo_bamai_diskio_write_time_seconds_total Total seconds spent by completed write requests.
# TYPE huatuo_bamai_diskio_write_time_seconds_total counter
huatuo_bamai_diskio_write_time_seconds_total{device="sda",host="hostname",region="dev"} 6
# HELP huatuo_bamai_diskio_disk_iowait_percent CPU time spent waiting for I/O during the collection interval.
# TYPE huatuo_bamai_diskio_disk_iowait_percent gauge
huatuo_bamai_diskio_disk_iowait_percent{host="hostname",region="dev"} 50
| 指标 |
意义 |
单位 |
对象 |
标签 |
| read_requests_total |
累积读请求完成数(field 4),使用 rate() 计算读 IOPS |
计数 |
宿主 |
host, region, device |
| write_requests_total |
累积写请求完成数(field 8),使用 rate() 计算写 IOPS |
计数 |
宿主 |
host, region, device |
| read_bytes_total |
累积读取字节数(field 6 × 512),使用 rate() 计算读吞吐量 |
字节 |
宿主 |
host, region, device |
| written_bytes_total |
累积写入字节数(field 10 × 512),使用 rate() 计算写吞吐量 |
字节 |
宿主 |
host, region, device |
| read_time_seconds_total |
已完成读请求的累积耗时(field 7) |
秒 |
宿主 |
host, region, device |
| write_time_seconds_total |
已完成写请求的累积耗时(field 11) |
秒 |
宿主 |
host, region, device |
| io_in_progress |
当前正在进行的 I/O 请求数,即队列深度(field 12) |
计数 |
宿主 |
host, region, device |
| disk_iowait_percent |
采集区间内 CPU 等待 I/O 完成的时间占比 |
百分比 |
宿主 |
host, region |
XFS 文件系统统计
xfs 从 sysfs 采集每设备统计,指标前缀为 huatuo_bamai_xfs_,标签为
device、host、region。log_free_bytes 为 Gauge,_total 为累积 Counter。
| 指标后缀 |
意义 |
单位 |
| log_free_bytes |
log 剩余可用空间 |
字节 |
| log_space_sleep_total |
等待 log 空间的累计次数 |
计数 |
| alloc_blocks_total |
累计分配 block 数 |
块 |
| alloc_extents_total |
累计分配 extent 数 |
计数 |
| inode_attempts_total |
inode cache 累计请求数 |
计数 |
| inode_missed_total |
inode cache 累计 miss 数 |
计数 |
| buf_busy_locked_total |
buffer busy-locked 累计次数 |
计数 |
| buf_locked_waited_total |
等待 buffer 锁的累计次数 |
计数 |
无法获取 log 可用空间时不输出 log_free_bytes。新增 XFS 挂载后需重启 daemon。
通用系统
Soft Lockup
# HELP huatuo_bamai_softlockup_total softlockup counter
# TYPE huatuo_bamai_softlockup_total counter
huatuo_bamai_softlockup_total{host="hostname",region="dev"} 0
| 指标 |
意义 |
单位 |
对象 |
取值 |
标签 |
| softlockup_total |
系统 softlockup 事件计数 |
计数 |
物理机 |
BPF |
|
HungTask
# HELP huatuo_bamai_hungtask_total hungtask counter
# TYPE huatuo_bamai_hungtask_total counter
huatuo_bamai_hungtask_total{host="hostname",region="dev"} 0
| 指标 |
意义 |
单位 |
对象 |
取值 |
标签 |
| hungtask_total |
系统 hungtask 事件计数 |
计数 |
物理机 |
BPF |
|
GPU
当前版本支持的 GPU 平台:
| 指标 |
描述 |
单位 |
统计纬度 |
指标来源 |
| metax_gpu_sdk_info |
GPU SDK 信息 |
- |
version |
sml.GetSDKVersion |
| metax_gpu_driver_info |
GPU 驱动信息 |
- |
version |
sml.GetGPUVersion with driver unit |
| metax_gpu_info |
GPU 基本信息 |
- |
gpu |
|
| metax_gpu_board_power_watts |
GPU 板级功耗 |
瓦特(W) |
gpu |
sml.ListGPUBoardWayElectricInfos |
| metax_gpu_pcie_link_speed_gt_per_second |
GPU PCIe 当前链路速率 |
GT/s |
gpu |
sml.GetGPUPcieLinkInfo |
| metax_gpu_pcie_link_width_lanes |
GPU PCIe 当前链路宽度 |
链路宽度(通道数) |
gpu |
sml.GetGPUPcieLinkInfo |
| metax_gpu_pcie_receive_bytes_per_second |
GPU PCIe 接收吞吐率 |
Bps |
gpu |
sml.GetGPUPcieThroughputInfo |
| metax_gpu_pcie_transmit_bytes_per_second |
GPU PCIe 发送吞吐率 |
Bps |
gpu |
sml.GetGPUPcieThroughputInfo |
| metax_gpu_metaxlink_link_speed_gt_per_second |
GPU MetaXLink 当前链路速率 |
GT/s |
gpu, metaxlink |
sml.ListGPUMetaXLinkLinkInfos |
| metax_gpu_metaxlink_link_width_lanes |
GPU MetaXLink 当前链路宽度 |
链路宽度(通道数) |
gpu, metaxlink |
sml.ListGPUMetaXLinkLinkInfos |
| metax_gpu_metaxlink_receive_bytes_per_second |
GPU MetaXLink 接收吞吐率 |
Bps |
gpu, metaxlink |
sml.ListGPUMetaXLinkThroughputInfos |
| metax_gpu_metaxlink_transmit_bytes_per_second |
GPU MetaXLink 发送吞吐率 |
Bps |
gpu, metaxlink |
sml.ListGPUMetaXLinkThroughputInfos |
| metax_gpu_metaxlink_receive_bytes_total |
GPU MetaXLink 接收数据总量 |
字节 |
gpu, metaxlink |
sml.ListGPUMetaXLinkTrafficStatInfos |
| metax_gpu_metaxlink_transmit_bytes_total |
GPU MetaXLink 发送数据总量 |
字节 |
gpu, metaxlink |
sml.ListGPUMetaXLinkTrafficStatInfos |
| metax_gpu_metaxlink_aer_errors_total |
GPU MetaXLink AER 错误次数 |
计数 |
gpu, metaxlink, error_type |
sml.ListGPUMetaXLinkAerErrorsInfos |
| metax_gpu_status |
GPU 状态 |
- |
gpu, die |
sml.GetDieStatus |
| metax_gpu_temperature_celsius |
GPU 温度 |
摄氏度 |
gpu, die |
sml.GetDieTemperature |
| metax_gpu_utilization_percent |
GPU 利用率(0–100) |
% |
gpu, die, ip |
sml.GetDieUtilization |
| metax_gpu_memory_total_bytes |
显存总容量 |
字节 |
gpu, die |
sml.GetDieMemoryInfo |
| metax_gpu_memory_used_bytes |
已使用显存容量 |
字节 |
gpu, die |
sml.GetDieMemoryInfo |
| metax_gpu_clock_mhz |
GPU 时钟频率 |
兆赫兹(MHz) |
gpu, die, ip |
sml.ListDieClocks |
| metax_gpu_clocks_throttling |
GPU 时钟降频原因 |
- |
gpu, die, reason |
sml.GetDieClocksThrottleStatus |
| metax_gpu_dpm_performance_level |
GPU DPM 性能等级 |
- |
gpu, die, ip |
sml.GetDieDPMPerformanceLevel |
| metax_gpu_ecc_memory_errors_total |
GPU ECC 内存错误次数 |
计数 |
gpu, die, memory_type, error_type |
sml.GetDieECCMemoryInfo |
| metax_gpu_ecc_memory_retired_pages_total |
GPU ECC 内存退役页数 |
计数 |
gpu, die |
sml.GetDieECCMemoryInfo |
摩尔线程 GPU 监控通过 MTML(摩尔线程管理库)实现。库文件在启动时通过 SONAME 搜索(libmtml.so.2 然后 libmtml.so)自动发现。静态设备信息会被缓存,仅在重新初始化时重建;动态指标在每次抓取时采集。
配置:从 BlackList 中移除 mthreads_gpu 以启用。指标组由 [MetricCollector.Mthreads] 开关控制(EnableHealth、EnablePCIe、EnableMTLink)。
| 指标 |
描述 |
单位 |
标签 |
来源 |
| huatuo_bamai_mthreads_gpu_library_info |
MTML 库信息 |
- |
version |
mtml.LibraryVersion |
| huatuo_bamai_mthreads_gpu_device_info |
GPU 信息 |
- |
gpu, name, brand, serial |
mtml.Device.Name/Brand/SerialNumber |
| huatuo_bamai_mthreads_gpu_device_pci_info |
GPU PCI 信息 |
- |
gpu, sbdf |
mtml.Device.PciSbdf |
| huatuo_bamai_mthreads_gpu_device_spec |
GPU 规格 |
- |
gpu, cores |
mtml.Device.GpuCores |
| huatuo_bamai_mthreads_gpu_device_bios_version |
GPU BIOS 版本 |
- |
gpu, bios |
mtml.Device.BiosVersion |
| huatuo_bamai_mthreads_gpu_device_musa_capability |
GPU MUSA 计算能力 |
- |
gpu, musa_capability |
mtml.Device.MusaComputeCapability |
| huatuo_bamai_mthreads_gpu_memory_info |
GPU 内存信息 |
- |
gpu, type, vendor, bus_width |
mtml.Device.InitMemory |
| huatuo_bamai_mthreads_gpu_pcie_link_max_speed_gt_per_sec |
GPU PCIe 最大链路速率(硬件能力) |
GT/s |
gpu |
mtml.Device.PciInfo |
| huatuo_bamai_mthreads_gpu_pcie_link_max_width_lanes |
GPU PCIe 最大链路宽度(硬件能力) |
lanes |
gpu |
mtml.Device.PciInfo |
| huatuo_bamai_mthreads_gpu_device_power_watts |
GPU 设备功耗 |
W |
gpu |
mtml.Device.PowerUsage |
| huatuo_bamai_mthreads_gpu_gpu_temperature_celsius |
GPU 温度 |
°C |
gpu |
mtml.Gpu.Temperature |
| huatuo_bamai_mthreads_gpu_memory_temperature_celsius |
GPU 内存温度 |
°C |
gpu |
mtml.Memory.Temperature |
| huatuo_bamai_mthreads_gpu_gpu_utilization_percent |
GPU 利用率(0-100) |
% |
gpu |
mtml.Gpu.Utilization |
| huatuo_bamai_mthreads_gpu_memory_utilization_percent |
GPU 内存利用率(0-100) |
% |
gpu |
mtml.Memory.Utilization |
| huatuo_bamai_mthreads_gpu_memory_total_bytes |
GPU 总内存 |
bytes |
gpu |
mtml.Memory.Total |
| huatuo_bamai_mthreads_gpu_memory_used_bytes |
GPU 已使用内存 |
bytes |
gpu |
mtml.Memory.Used |
| huatuo_bamai_mthreads_gpu_gpu_clock_mhz |
GPU 时钟频率 |
MHz |
gpu |
mtml.Gpu.Clock |
| huatuo_bamai_mthreads_gpu_gpu_max_clock_mhz |
GPU 最大时钟频率 |
MHz |
gpu |
mtml.Gpu.MaxClock |
| huatuo_bamai_mthreads_gpu_memory_clock_mhz |
GPU 内存时钟频率 |
MHz |
gpu |
mtml.Memory.Clock |
| huatuo_bamai_mthreads_gpu_memory_max_clock_mhz |
GPU 内存最大时钟频率 |
MHz |
gpu |
mtml.Memory.MaxClock |
| huatuo_bamai_mthreads_gpu_gpu_voltage_volts |
GPU 电压 |
V |
gpu |
mtml.Gpu.Voltage |
| huatuo_bamai_mthreads_gpu_gpu_power_limit_watts |
GPU 强制功耗限制 |
W |
gpu |
mtml.Gpu.EnforcedPowerLimit |
| huatuo_bamai_mthreads_gpu_gpu_power_default_limit_watts |
GPU 默认功耗管理限制 |
W |
gpu |
mtml.Gpu.PowerManagementDefaultLimit |
| huatuo_bamai_mthreads_gpu_fan_rpm |
GPU 风扇转速 |
RPM |
gpu, fan |
mtml.Device.FanRpm |
| huatuo_bamai_mthreads_gpu_fan_speed_percent |
GPU 风扇速度百分比 |
% |
gpu, fan |
mtml.Device.FanSpeed |
| huatuo_bamai_mthreads_gpu_gpu_pstate |
GPU 性能状态(0=P0) |
- |
gpu |
mtml.Device.PerformanceState |
| huatuo_bamai_mthreads_gpu_vpu_utilization_percent |
GPU VPU 利用率(0-100) |
% |
gpu |
mtml.Vpu.Utilization |
| huatuo_bamai_mthreads_gpu_vpu_encoder_utilization_percent |
GPU VPU 编码器利用率(0-100) |
% |
gpu |
mtml.Vpu.Utilization |
| huatuo_bamai_mthreads_gpu_vpu_decoder_utilization_percent |
GPU VPU 解码器利用率(0-100) |
% |
gpu |
mtml.Vpu.Utilization |
| huatuo_bamai_mthreads_gpu_vpu_clock_mhz |
GPU VPU 时钟频率 |
MHz |
gpu |
mtml.Vpu.Clock |
| huatuo_bamai_mthreads_gpu_pcie_link_speed_gt_per_sec |
GPU PCIe 当前链路速率 |
GT/s |
gpu |
mtml.Device.PciInfo |
| huatuo_bamai_mthreads_gpu_pcie_link_width_lanes |
GPU PCIe 当前链路宽度 |
lanes |
gpu |
mtml.Device.PciInfo |
| huatuo_bamai_mthreads_gpu_pcie_replay_total |
GPU PCIe 重放计数器 |
count |
gpu |
mtml.Device.PcieReplayCounter |
| huatuo_bamai_mthreads_gpu_mtlink_state |
GPU MtLink 状态(0=DOWN,1=UP,2=DOWNGRADE) |
- |
gpu, link |
mtml.Device.MtLinkState |
| huatuo_bamai_mthreads_gpu_mtlink_link_bandwidth_gb_s |
GPU MtLink 每链路最大带宽(设备静态规格,非实时吞吐) |
GB/s |
gpu |
mtml.Device.MtLinkSpec |
| huatuo_bamai_mthreads_gpu_mtlink_link_count |
GPU MtLink 最大支持链路数(设备静态规格) |
links |
gpu |
mtml.Device.MtLinkSpec |
5.2 - 异常事件诊断
🎯 关于 HUATUO(华佗)
HUATUO(华佗)是由滴滴开源并依托 CCF(中国计算机学会)孵化的操作系统深度观测项目,专注为云原生通用计算、AI 计算、云服务、基础服务等提供操作系统内核级深度观测能力。
📖 概述
HUATUO 基于 eBPF 技术,对 Linux 内核中的 CPU 调度、内存子系统、网络协议栈、硬件错误等核心子系统实施实时异常事件观测。当内核触发 softlockup、OOM、硬件 MCE 等异常状态时,eBPF 程序通过挂钩(hook)内核函数(kprobe)或内核 tracepoint,在事件发生的第一时间采集进程信息、内核调用栈、网络上下文等现场数据,并经由 perf event 环形缓冲区传递至用户态处理程序,最终持久化至 Elasticsearch 或本地磁盘文件。
相比传统的基于内核日志(dmesg/syslog)采集方案,eBPF 事件观测具备更低的数据丢失风险——不会因内核日志缓冲区满溢而丢失关键事件;同时可捕获不会写入内核日志的短暂性异常(如调度 tick 间隔过长);并提供容器级别的事件关联信息,满足云原生场景下的精准定位需求。
当前支持 12 类事件的持续观测,覆盖 CPU 调度健康状态(sched_tick、softlockup、hungtask)、内存压力(memory_oom_kill、memory_reclaim_events)、网络协议栈(dropwatch、tcp_retransmit、net_rx_latency、netdev_events、netdev_bonding_lacp、netdev_txqueue_timeout)以及硬件可靠性(ras)等方面。
🎯 场景
Kubernetes 容器内存故障定位:在容器频繁 OOM 重启场景下,memory_oom_kill 事件同时记录被 OOM Killer 终止的进程(victim)与触发 OOM 的进程(trigger)的 memcg cgroup 指针及容器 ID,结合时序数据可快速定位内存资源争抢的根因容器,降低人工排查容器日志的时间成本。
AI 训练集群硬件故障感知:在 GPU 训练服务器上,ras 事件持续采集 MCE(Machine Check Exception)、EDAC 内存控制器错误和 PCIe AER(Advanced Error Reporting)错误,对错误进行严重程度分级(Corrected / UncorrectedRecoverable / UncorrectedFatal),在训练任务中断前提前感知硬件老化或单点故障,减少因硬件故障导致的训练任务损失。
网络性能毛刺分析:dropwatch 观测内核网络协议栈丢包行为,tcp_retransmit 观测 TCP 重传活动,net_rx_latency 检测单个数据包从网卡驱动到用户态的完整接收路径延迟,按阶段(网卡到内核、内核到 TCP、TCP 到用户态)分别设置阈值(默认 5ms / 10ms / 115ms),精准定位造成业务超时的网络层位置,提升网络问题根因定位效率。
主机调度健康观测:sched_tick(调度 tick 间隔,默认阈值 10ms)、softlockup(CPU 无法调度,约 1 秒)、hungtask(D 状态进程任务挂起)三类事件联合覆盖 CPU 调度路径的异常状态,当系统出现卡顿、响应超时等现象时,自动保留内核调用栈等诊断信息,支持在故障消失后的离线分析。
🚀 使用
配置参数
各事件可通过以下参数进行调优,参数均提供默认值,无需配置即可运行:
| 参数 |
默认值 |
说明 |
sched_tick.interval_threshold |
10000000(10ms,纳秒) |
调度 tick 间隔阈值 |
memory_reclaim.blocked_threshold |
900000000(900ms,纳秒) |
直接内存回收时间触发阈值 |
net_rx_latency.driver2net_rx |
5(ms) |
从网卡驱动到 __netif_receive_skb 的延迟阈值 |
net_rx_latency.driver2tcp |
10(ms) |
从网卡驱动到 tcp_v4_rcv 的延迟阈值 |
net_rx_latency.driver2userspace |
115(ms) |
从网卡驱动到用户态拷贝(skb_copy_datagram_iovec)的延迟阈值 |
net_rx_latency.excluded_host_netnamespace |
true |
是否过滤宿主机网络命名空间(默认仅观测容器) |
net_rx_latency.excluded_container_qos |
[] |
需要排除的容器 QoS 级别列表 |
dropwatch.filter |
tcp |
在 dropwatch 事件输出前执行的 tcpdump 风格报文过滤表达式 |
dropwatch.max_events_per_second |
100 |
每秒最多输出的 dropwatch 事件数;0 表示不限速 |
dropwatch.exclude_containers |
[] |
预留字段;当前 dropwatch 事件链路不会应用该配置 |
netdev.device_list |
[] |
需要监控链路状态的网卡设备名称列表 |
ras.mce_thr_backoff |
1800(秒) |
MCE 阈值中断(THR)事件上报冷却时间,防止中断风暴 |
issues_list |
[] |
已知问题抑制规则;分别匹配 net_rx_latency 事件标题和 dropwatch 内核调用栈 |
事件列表
| 事件名称(tracer_name) |
探针类型 |
触发条件 |
典型场景 |
sched_tick |
kprobe |
调度 tick 间隔 >= 阈值(默认 10ms) |
系统卡顿、网络延迟、调度延迟 |
softlockup |
kprobe |
CPU 长时间无法调度(约 1 秒) |
系统软锁死、响应异常 |
hungtask |
kprobe |
D 状态进程任务挂起 |
瞬时批量 D 进程、IO 阻塞 |
memory_oom_kill |
kprobe |
OOM Killer 触发 |
容器/宿主机内存耗尽 |
memory_reclaim_events |
kprobe |
容器进程直接回收时间 > 阈值(默认 900ms) |
内存压力导致业务卡顿 |
ras |
tracepoint |
CPU/MEM/PCIe 硬件错误 |
硬件故障感知 |
dropwatch |
tracepoint |
内核网络协议栈丢包 |
协议栈丢包导致业务毛刺 |
tcp_retransmit |
tracepoint;TLP 使用可选 kprobe |
TCP 重传或 Tail Loss Probe |
TCP 丢包、乱序、拥塞及延迟诊断 |
net_rx_latency |
kprobe |
协议栈接收延迟超分段阈值 |
接收延迟引起业务超时 |
netdev_events |
netlink |
网卡链路状态变化 |
网卡物理链路故障 |
netdev_bonding_lacp |
kprobe |
LACP 协议状态变化(仅 802.3ad 模式环境) |
物理机与交换机故障边界界定 |
netdev_txqueue_timeout |
kprobe |
网卡发送队列超时 |
网卡发送队列硬件故障 |
tcp_retransmit 的使用方式、字段、分类和丢包关联请参考 tcpshark 文档。
通用字段说明
所有事件数据均包含以下通用字段:
- hostname:物理机 hostname
- region:物理机所在可用区
- uploaded_timestamp:数据上传时间
- container_id:如果事件关联容器,则记录的容器 ID
- container_hostname:如果事件关联容器,则记录的容器 hostname
- container_host_namespace:如果事件关联容器,则记录容器的 K8s 命名空间
- container_type:容器类型,例如
normal 普通容器,sidecar 边车容器等
- container_qos:容器 QoS 级别
- tracer_name:事件名称(如
sched_tick、memory_oom_kill 等)
- tracer_id:此次的 tracing ID
- observed_timestamp:触发 tracing 时间
- tracer_type:观测类型,即时事件记录固定为
event
- tracer_data:特定事件私有数据(详见各事件说明)
1. sched_tick 调度 tick 间隔
功能描述 检测相邻调度 tick 的总间隔;间隔达到阈值时记录当前内核调用栈和进程信息。该事件可发现 IRQ 长时间关闭、CPU 停顿或虚拟化调度延迟等问题,但不能单独证明软中断被禁用。comm 和 pid 表示上报 tick 所中断的任务,不表示造成延迟的任务。
适用场景
- 内核或驱动长时间关闭本地中断,或 hardirq/NMI 长时间占用 CPU。
- 虚拟机 vCPU 被宿主机长时间抢占,包括高 steal time 和调度停顿。
- SMI、固件停顿、clockevent 延迟投递或丢失等底层异常。
使用边界 成功进入 NO_HZ 的正常停 tick 会被过滤。普通 CPU 高负载或 softirq backlog 本身不等同于 tick 延迟。阈值应高于目标机器的正常 tick 周期;事件栈仅表示延迟结束后首个 tick 的现场,需要结合 IRQ、steal time 和硬件指标定位根因。
数据存储 事件数据自动存储至 Elasticsearch 或物理机磁盘文件。
示例数据
{
    "uploaded_timestamp": "2025-06-11T16:05:16.251152703+08:00",
    "hostname": "***",
    "tracer_data": {
        "tick_interval_ns": 237328905,
        "tick_interval_threshold_ns": 10000000,
        "comm": "***-agent",
        "pid": 688073,
        "cpu": 1,
        "stack": "scheduler_tick/..."
    },
    "observed_timestamp": "2025-06-11T16:05:16.251+08:00",
    "tracer_type": "event",
    "region": "***",
    "tracer_name": "sched_tick"
}
字段含义解释
- comm:触发事件的进程名称
- stack:延迟结束后的首个调度 tick 上采集的内核调用栈
- tick_interval_ns:相邻调度 tick 的总间隔(纳秒)
- cpu:发生事件的 CPU 编号
- tick_interval_threshold_ns:调度 tick 间隔阈值(纳秒),达到该值则记录事件
- pid:上报 tick 所中断任务的进程 ID
2. dropwatch 协议栈丢包
功能描述 检测内核网络协议栈中的丢包行为,输出丢包时的内核调用栈、网络五元组、TCP 状态等信息。可通过可选的调用栈过滤器抑制经本机验证的噪声模式。type 字段为兼容 TCP 丢包类型而预留,当前未赋值。
数据存储 自动存储至 Elasticsearch 或物理机磁盘文件。
示例数据
{
    "observed_timestamp": "2026-07-23T02:14:40.304775546Z",
    "tracer_data": {
        "drop_reason": "SKB_DROP_REASON_NOT_SPECIFIED",
        "source": "events",
        "comm": "kubelet",
        "pid": 1687046,
        "net_namespace_cookie": 123456789,
        "net_namespace_inum": 402653184,
        "netdev_queue_mapping": 3,
        "netdev_linkstatus": ["linkStatusUp"],
        "netdev_name": "eth0",
        "netdev_ifindex": 2,
        "packet_eth_proto": "0x0800",
        "packet_len_bytes": 1460,
        "layers": {
            "label": "IPv4/TCP",
            "ipv4": {
                "saddr": "10.79.68.62",
                "daddr": "10.134.72.4",
                "protocol": "TCP"
            },
            "tcp": {
                "sport": 8080,
                "dport": 49000,
                "seq": 1009085774,
                "ack_seq": 689410995,
                "sk_state": "ESTABLISHED"
            }
        },
        "stack": "kfree_skb/..."
    }
}
字段含义解释
- type:预留丢包类型,当前未赋值且不会出现在 JSON 中;预留编码为
1(通用丢包)、2(SYN 洪泛)、3(半连接队列溢出)、4(全连接队列溢出)
- drop_reason:内核数据包丢弃原因
- source:事件来源(独立运行 dropwatch 时为
tools,由 huatuo-bamai 启动时为 events)
- comm:触发丢包的进程名称
- pid:进程 ID
- net_namespace_cookie / net_namespace_inum:用于容器归属解析的网络命名空间值
- netdev_queue_mapping:网卡队列索引
- netdev_linkstatus:网卡链路状态标志列表
- netdev_name:网卡设备名称
- netdev_ifindex:网卡接口索引
- packet_len_bytes:数据包长度(字节)
- layers.ipv4.saddr / layers.ipv4.daddr:源 IP 和目的 IP 地址
- layers.tcp.sport / layers.tcp.dport:源端口和目的端口
- layers.tcp.seq / layers.tcp.ack_seq:TCP 序列号和确认序列号
- layers.tcp.sk_state:丢包时 TCP 连接状态
- stack:丢包发生时的内核调用栈
3. net_rx_latency 协议栈延迟
功能描述 检测协议栈接收方向(网卡驱动 → 内核协议栈 → 用户态主动收包)的分段延迟事件。在接收路径上设置三个观测点,任意阶段延迟超过对应阈值(默认:网卡到内核 5ms、内核到 TCP 10ms、TCP 到用户态 115ms)时触发,记录网络五元组、TCP 序列号、延迟位置及延迟时间。支持所有 TCP 状态的报文观测,不限于 ESTABLISHED 状态,可捕获 SYN、FIN、TIME_WAIT 等非 ESTABLISHED 状态下的接收延迟事件。默认过滤宿主机网络命名空间,仅观测容器网络。
数据存储 自动存储至 Elasticsearch 或物理机磁盘文件。
示例数据
{
    "observed_timestamp": "2025-06-11T00:00:00Z",
    "tracer_data": {
        "comm": "nginx",
        "pid": 2921092,
        "latency_stage": "RX_STAGE_USERCOPY",
        "latency_ms": 95973,
        "latency_threshold_ms": 115,
        "tcp_state": "ESTABLISHED",
        "tcp_saddr": "10.156.248.76",
        "tcp_daddr": "10.134.72.4",
        "tcp_sport": 9213,
        "tcp_dport": 49000,
        "tcp_seq": 1009085774,
        "tcp_ack_seq": 689410995,
        "net_namespace_cookie": 123456789,
        "net_namespace_inum": 402653184,
        "packet_len_bytes": 26064
    }
}
字段含义解释
- comm:触发事件的进程名称
- pid:触发事件的进程 ID
- latency_stage:延迟发生的阶段(
RX_STAGE_NETIF 网卡到内核 / RX_STAGE_TCPV4 内核到 TCP / RX_STAGE_USERCOPY TCP 到用户态)
- latency_ms:实际延迟时间(毫秒)
- latency_threshold_ms:触发事件的延迟阈值(毫秒)
- tcp_state:TCP 连接状态(支持所有状态,如
ESTABLISHED、SYN_SENT、FIN_WAIT、TIME_WAIT 等)
- tcp_saddr / tcp_daddr:源 IP / 目的 IP 地址
- tcp_sport / tcp_dport:源端口 / 目的端口
- tcp_seq / tcp_ack_seq:TCP 序列号 / 确认序列号
- net_namespace_cookie:网络命名空间 cookie(内核 ≥ 5.14 可用,用于高效容器关联)
- net_namespace_inum:网络命名空间 inum
- packet_len_bytes:数据包长度(字节)
4. memory_oom_kill 内存耗尽
OOM kill 追踪器现命名为 memory_oom_kill(此前为 memory_oom,更早为 oom),需同步更新黑名单、事件过滤器和告警查询。指标前缀现为 huatuo_bamai_memory_oom_kill_,替代 huatuo_bamai_memory_oom_ 及更早的 huatuo_bamai_oom_,需同步更新指标仪表盘和记录规则。历史事件保留原名称,跨版本查询需匹配这三个名称;内置事件仪表盘已覆盖三者。
功能描述 检测宿主机或容器内发生的 OOM(Out of Memory)事件,记录被 OOM Killer 终止的进程(victim)与触发 OOM 的进程(trigger)信息,以及对应容器和 memory cgroup 的详细信息,提供完整的故障快照。同时维护宿主机和各容器的 OOM 计数指标。
数据存储 自动存储至 Elasticsearch 或物理机磁盘文件。
示例数据
{
    "tracer_data": {
        "trigger_memcg_css": "0xff4b8d8be3818000",
        "trigger_container_id": "***",
        "trigger_container_hostname": "***.docker",
        "trigger_pid": 3218804,
        "trigger_process_name": "java",
        "victim_memcg_css": "0xff4b8d8be3818000",
        "victim_container_id": "***",
        "victim_container_hostname": "***.docker",
        "victim_pid": 3218745,
        "victim_process_name": "java",
        "cgroup_memory_limit": 2147483648,
        "cgroup_memory_usage": 2143289344,
        "memory_snapshot": {
            "top_processes": [
                {
                    "pid": 3218745,
                    "process_name": "java",
                    "vm_rss": 1604321280,
                    "rss_anon": 1509949440,
                    "rss_file": 83886080,
                    "rss_shmem": 0,
                    "vm_swap": 0,
                    "total": 1593835520
                }
            ],
            "host_meminfo": {
                "MemAvailable": 3355443200,
                "Cached": 1073741824,
                "Slab": 268435456
            },
            "victim_cgroup": {
                "container_id": "***",
                "cgroup_path": "kubepods.slice/...",
                "current": 2143289344,
                "max": 2147483648,
                "stat": {
                    "anon": 1509949440,
                    "file": 83886080
                },
                "events": {
                    "oom": 1,
                    "oom_kill": 1
                }
            }
        }
    }
}
字段含义解释
- victim_process_name / victim_pid:被 OOM Killer 终止的进程名称与 PID
- victim_container_hostname / victim_container_id:被终止进程所在的容器主机名与容器 ID
- victim_memcg_css:被终止进程对应的 memory cgroup 指针(十六进制)
- trigger_process_name / trigger_pid:触发 OOM 的进程名称与 PID
- trigger_container_hostname / trigger_container_id:触发进程所在的容器主机名与容器 ID
- trigger_memcg_css:触发进程对应的 memory cgroup 指针(十六进制)
- cgroup_memory_limit / cgroup_memory_usage:内核事件中携带的 cgroup 内存限制与使用量
- memory_snapshot.top_processes:OOM 现场按 RSS/swap 排序的 Top 进程,包含
RssAnon、RssFile、RssShmem、VmRSS、VmSwap
- memory_snapshot.host_meminfo:OOM 现场关键宿主机
/proc/meminfo 字段,如 MemAvailable、Cached、Slab、swap、anon/file 活跃页等
- memory_snapshot.trigger_cgroup / victim_cgroup:触发容器和受害容器的 cgroup 路径、current/max、
memory.stat 和 memory.events
5. softlockup 软锁死
功能描述 检测系统 softlockup 事件(CPU 长时间无法被调度,约 1 秒),提供导致锁死的目标进程信息、所在 CPU 及所有 CPU 的 NMI 回溯信息。采用退避(backoff)策略,同一轮事件风暴期间上报间隔从 10 分钟递增至最长 3 小时,防止重复上报。同时维护 softlockup 发生次数的计数指标。
数据存储 自动存储至 Elasticsearch 或物理机磁盘文件。
示例数据
{
    "tracer_data": {
        "cpu": 15,
        "pid": 12345,
        "comm": "kworker/15:0",
        "cpus_stack": "2025-06-10 14:30:22 sysrq: Show backtrace of all active CPUs\nNMI backtrace for cpu 15\n..."
    }
}
字段含义解释
- cpu:发生 softlockup 的 CPU 编号
- pid:触发 softlockup 的进程 PID
- comm:触发 softlockup 的进程名称
- cpus_stack:所有 CPU 的 NMI 回溯信息(多行文本,包含时间戳和调用栈)
6. hungtask 任务挂起
功能描述 检测系统 hungtask 事件,捕获当前所有处于 D 状态(不可中断睡眠)的进程内核栈及所有 CPU 的回溯信息,用于保留故障现场。采用退避策略,同一轮事件风暴期间上报间隔从 10 分钟递增至最长 3 小时。同时维护 hungtask 发生次数的计数指标。注意:部分 Linux 发行版(如 Fedora 42)默认禁用 hungtask 检测,此时该观测器不会启动。
数据存储 自动存储至 Elasticsearch 或物理机磁盘文件。
示例数据
{
    "tracer_data": {
        "tid": 2567042,
        "comm": "kworker/u48:2",
        "cpus_stack": "2025-06-10 09:57:14 sysrq: Show backtrace of all active CPUs\nNMI backtrace for cpu 33\n...",
        "blocked_processes_stack": "task:java            state:D stack:    0 pid: 12345 ..."
    }
}
字段含义解释
- tid:触发 hungtask 检测的任务 TID
- comm:触发 hungtask 检测的任务名称
- cpus_stack:所有 CPU 的 NMI 回溯信息(多行文本,包含时间戳和调用栈)
- blocked_processes_stack:D 状态进程的内核栈信息
7. memory_reclaim_events 内存回收
功能描述 检测容器进程发生直接内存回收(direct reclaim)的事件,当同一进程在 1 秒内直接回收时间超过阈值(默认 900ms)时触发,记录回收耗时、进程及容器信息。注意:该观测器仅记录容器进程的内存回收事件,宿主机进程的事件会被过滤。
数据存储 自动存储至 Elasticsearch 或物理机磁盘文件。
示例数据
{
    "tracer_data": {
        "pid": 1896137,
        "tid": 1896138,
        "comm": "java",
        "reclaim_duration_ns": 1412702917
    }
}
字段含义解释
- comm:触发直接内存回收的进程名称
- pid:触发进程的 PID
- tid:触发线程的 TID
- reclaim_duration_ns:直接回收耗时(纳秒)
8. ras 硬件错误
功能描述 通过内核 tracepoint 检测 CPU、内存、PCIe 等硬件错误,支持 5 种硬件错误来源:MCE(Machine Check Exception)、EDAC(内存控制器)、ACPI/GHES(非标准硬件错误)、PCIe AER(高级错误上报)、MCE 阈值中断(THR)。错误按严重程度分级:Corrected(已纠正)、UncorrectedRecoverable(未纠正可恢复)、UncorrectedFatal(未纠正致命)。MCE 阈值中断事件采用冷却策略(默认 30 分钟),防止中断风暴触发大量重复上报。
数据存储 自动存储至 Elasticsearch 或物理机磁盘文件。
MCE 示例数据
{
    "tracer_data": {
        "dev": "CPU/MEM",
        "event": "MCE",
        "type": "UncorrectedRecoverable",
        "info": "{\"mcg_cpu_cap\":4096,\"banks_msr_status\":9295429630892703744,\"cpu\":2,\"socketid\":0,\"bank\":5}"
    }
}
PCIe AER 示例数据
{
    "observed_timestamp": "2025-06-11T00:00:00Z",
    "tracer_data": {
        "dev": "PCIe 0000:3b:00.0",
        "event": "AER",
        "type": "UncorrectedRecoverable",
        "info": "{\"dev_name\":\"0000:3b:00.0\",\"err_type\":\"UncorrectedRecoverable\",\"err_reason\":\"Completion Timeout\",\"tlp_header\":\"not available\"}"
    }
}
字段含义解释
- dev:发生错误的硬件设备(如
CPU/MEM、PCIe 0000:3b:00.0)
- event:错误类型(
MCE / EDAC / NON_STANDARD / AER / MCE_THRESHOLD)
- type:错误严重程度(
Corrected / UncorrectedRecoverable / UncorrectedDeferred / UncorrectedFatal / Info)
- observed_timestamp:顶层字段,表示用户态观测事件的 UTC 时间;
kernel_observed_timestamp 表示内核观测事件的 UTC 时间
- info:JSON 格式的详细错误信息,内容因 event 类型不同而不同
9. netdev_events 网络设备
功能描述 通过订阅内核 netlink RTM_NEWLINK 消息,检测网卡链路状态变化事件(down/up、MTU 变更、AdminDown、CarrierDown 等),输出接口名称、链路状态、MAC 地址及驱动信息。观测器启动时会扫描 device_list 中配置的网卡当前状态作为基线,后续仅上报状态变化事件。
数据存储 自动存储至 Elasticsearch 或物理机磁盘文件。
示例数据
{
    "tracer_data": {
        "ifname": "eth1",
        "index": 3,
        "linkstatus": "linkStatusAdminDown, linkStatusCarrierDown",
        "mac": "5c:6f:69:34:dc:72",
        "start": false,
        "driver": "ixgbe",
        "driver_version": "5.1.0-k",
        "firmware_version": "3.25 0x80000421 1.2163.0"
    }
}
字段含义解释
- ifname:网络接口名称(如
eth1)
- index:接口索引号
- linkstatus:链路状态变化描述(可包含多个状态)
- mac:网卡 MAC 地址
- start:是否为启动时扫描的基线事件(
true:启动扫描,false:实时变化事件)
- driver:网卡驱动名称
- driver_version:网卡驱动版本
- firmware_version:网卡固件版本
10. netdev_bonding_lacp LACP 协议
功能描述 检测 bonding 模式下 LACP(Link Aggregation Control Protocol,IEEE 802.3ad)协议的状态变化,读取并记录 /proc/net/bonding/ 下所有 bonding 接口的完整状态信息,包含模式、MII 状态、Actor/Partner 协商参数、Slave 链路状态等。仅在系统存在 IEEE 802.3ad bonding 模式接口时自动启用。
数据存储 自动存储至 Elasticsearch 或物理机磁盘文件。
示例数据
{
    "tracer_data": {
        "content": "/proc/net/bonding/bond0\nEthernet Channel Bonding Driver: v4.18.0...\nBonding Mode: IEEE 802.3ad Dynamic link aggregation\nMII Status: down\n..."
    }
}
字段含义解释
- content:完整的 bonding 接口状态信息(多行文本,包含所有 Slave 的 LACP 协商细节,等同于
/proc/net/bonding/bondX 文件内容)
11. netdev_txqueue_timeout 发送队列超时
功能描述 检测网卡发送队列超时(TX queue timeout)事件,记录发生超时的队列索引、设备名称和驱动名称,用于定位网卡发送方向的硬件故障。
数据存储 自动存储至 Elasticsearch 或物理机磁盘文件。
示例数据
{
    "tracer_data": {
        "queue_index": 3,
        "device_name": "eth0",
        "driver_name": "ixgbe"
    }
}
字段含义解释
- queue_index:发生超时的发送队列索引
- device_name:网卡设备名称
- driver_name:网卡驱动名称
⚙️ 原理
整体架构
HUATUO 的异常事件观测基于 eBPF 技术,在内核态以极低的性能损耗采集异常事件现场数据,并通过用户态守护进程完成格式化、过滤、容器信息关联和持久化存储。
graph TB
    subgraph "Linux Kernel"
        direction TB
        K1["kprobe 挂钩\n(sched_tick / softlockup / hungtask\n memory_oom_kill / memory_reclaim_events\n net_rx_latency / netdev_txqueue_timeout\n tcp_retransmit TLP,可选)"]
        K2["tracepoint 挂钩\n(ras: MCE / EDAC / AER / ACPI\n dropwatch: skb/kfree_skb\n tcp_retransmit:\n tcp/tcp_retransmit_skb /\n tcp/tcp_retransmit_synack)"]
        K3["netlink 订阅\n(netdev_events: RTM_NEWLINK)"]
        K4["kprobe 挂钩\n(netdev_bonding_lacp: 802.3ad)"]
        PEB["Perf Event 环形缓冲区\n(8192 页)"]
    end

    subgraph "HUATUO 用户态"
        direction TB
        EH["Go 事件处理 goroutine\n(每类事件独立运行)"]
        CF["过滤器\n(阈值判断 / 降噪 / 已知问题过滤)"]
        CM["容器信息关联\n(CSS → ContainerID\n NetNS → ContainerID)"]
    end

    subgraph "存储"
        ES["Elasticsearch"]
        DISK["本地磁盘文件"]
    end

    K1 --> PEB
    K2 --> PEB
    K4 --> PEB
    PEB --> EH
    K3 --> EH
    EH --> CF
    CF --> CM
    CM --> ES
    CM --> DISK
事件处理流程
sequenceDiagram
    participant K as Linux Kernel
    participant B as eBPF Program
    participant P as Perf Event Buffer
    participant H as Go 事件处理器
    participant F as 过滤器
    participant S as 存储

    K->>B: 触发 kprobe / tracepoint
    B->>B: 采集现场数据<br/>(进程信息 / 内核栈 / 网络上下文)
    B->>P: 写入 perf event 环形缓冲区
    H->>P: 读取事件数据(阻塞等待)
    H->>F: 格式化并执行过滤<br/>(阈值 / 降噪 / 已知问题)
    F->>H: 通过过滤的事件
    H->>H: 关联容器信息<br/>(CSS / NetNS 映射)
    H->>S: 持久化存储<br/>(Elasticsearch / 本地文件)
5.4 - 持续性能剖析
🎯 关于 HUATUO(华佗)
HUATUO(华佗)是由滴滴开源并依托 CCF(中国计算机学会)孵化的操作系统深度观测项目,广泛应用于AI 计算、AI 沙箱、云原生通用计算、云服务、基础架构服务等场景。
🚀 快速上手
示例基于仓库根目录下的 build/docker/docker-compose.yml,从零开始完成一次宿主机 CPU 性能剖析,并在 Grafana 中选择时间范围分析火焰图。
1. 启动服务
先修改配置,确保 huatuo-bamai 和 huatuo-apiserver 有写入 ES 的能力,才能正常保存 profile 数据。配置文件通过 docker compose 挂载到容器中,因此直接修改项目根目录下的文件即可。
huatuo-bamai.conf 中配置:
[HTTPServer.Auth]
    BearerToken = "REPLACE_WITH_NODE_TOKEN"

[Storage]
    [Storage.Elasticsearch]
        Address = "http://127.0.0.1:9200"
        Index = "huatuo_bamai"
        Username = "elastic"
        Password = "huatuo-bamai"
huatuo-apiserver.conf 中配置:
[Agent.Auth]
    BearerToken = "REPLACE_WITH_NODE_TOKEN"

[Elasticsearch]
    Address = "http://127.0.0.1:9200"
    Username = "elastic"
    Password = "huatuo-bamai"
    Index = "huatuo_bamai"

[Auth]
    [[Auth.Users]]
        ID = "administrator"
        BearerToken = "REPLACE_WITH_RANDOM_HEX"
        Admin = true
然后项目根目录执行:
docker compose --project-directory ./build/docker up
不加 -d,方便观察各组件启动日志。如需后台运行可另开终端操作,或自行加 -d。
启动后运行的组件及作用:
| 服务 |
作用 |
默认端口 |
huatuo-bamai |
采集 Agent,执行 profiler 采样 |
19704 |
huatuo-apiserver |
API 入口,创建任务、下发、查询火焰图 |
12740 |
elasticsearch |
存储 profile 数据(index:huatuo_bamai) |
9200 |
grafana |
火焰图面板展示 |
3000 |
2. 确认服务就绪
新开一个终端,执行以下命令确认服务就绪:
# Agent 健康检查
$ curl -s http://localhost:19704/version | jq .data.name

"huatuo-bamai"

# API Server 健康检查
$ curl -s http://localhost:12740/version | jq .data.name

"huatuo-apiserver"

# ES 索引状态
$ curl -s -u elastic:huatuo-bamai "http://localhost:9200/_cat/indices/huatuo_bamai?v"

health status index        uuid                   pri rep docs.count docs.deleted store.size pri.store.size dataset.size
yellow open   huatuo_bamai 147fzHJhQ820GjCKFLh5ZQ   1   1         42            0    297.8kb        297.8kb      297.8kb
设置环境变量便于后续调用:
API_BASE="http://127.0.0.1:12740"
API_TOKEN="REPLACE_WITH_RANDOM_HEX"
3. 创建宿主机 CPU 剖析任务
以 c 语言(原生,覆盖 C/C++/Go 等)为例,对宿主机整体采样 30 秒:
# hostname 需要使用节点的实际主机名
HOSTNAME=$(hostname)

JOB_ID=$(curl -s -X POST \
  -H "Authorization: Bearer ${API_TOKEN}" \
  -H "Content-Type: application/json" \
  -d "{
    \"type\": \"cpu\",
    \"language\": \"c\",
    \"mode\": \"oncpu\",
    \"scope\": \"host\",
    \"duration_seconds\": 30,
    \"hostname\": \"${HOSTNAME}\"
  }" \
  "${API_BASE}/v1/profiling" | jq -r .data.request_id)

echo "Job ID: $JOB_ID"
4. 验证数据已写入 ES
每 10 秒生成一个聚合窗口,30 秒任务约产生 3 条采样数据,等待 30 秒后确认数据写入:
$ curl -s -u elastic:huatuo-bamai "http://localhost:9200/huatuo_bamai/_count" \
  -H "Content-Type: application/json" \
  -d '{"query":{"exists":{"field":"profile_data.profile"}}}' | jq .count

3
5. Grafana 面板查看火焰图
示例是对本机进行剖析,打开 Continuous Profiling (host) 面板(容器是独立的面板):
操作步骤:
- 右上角选择时间范围,确保覆盖采样时间段
- 变量栏选择输入你的
hostname 和 选择 type 为 process_cpu:cpu:nanoseconds:cpu:nanoseconds
- 火焰图面板自动加载该时间窗口的聚合调用栈,随选择时间范围变化而自动聚合更新,focus block 可选定关心的调用栈
- symbol 排序、统计、筛选等操作在 top table 中进行,选择 Both 可展示
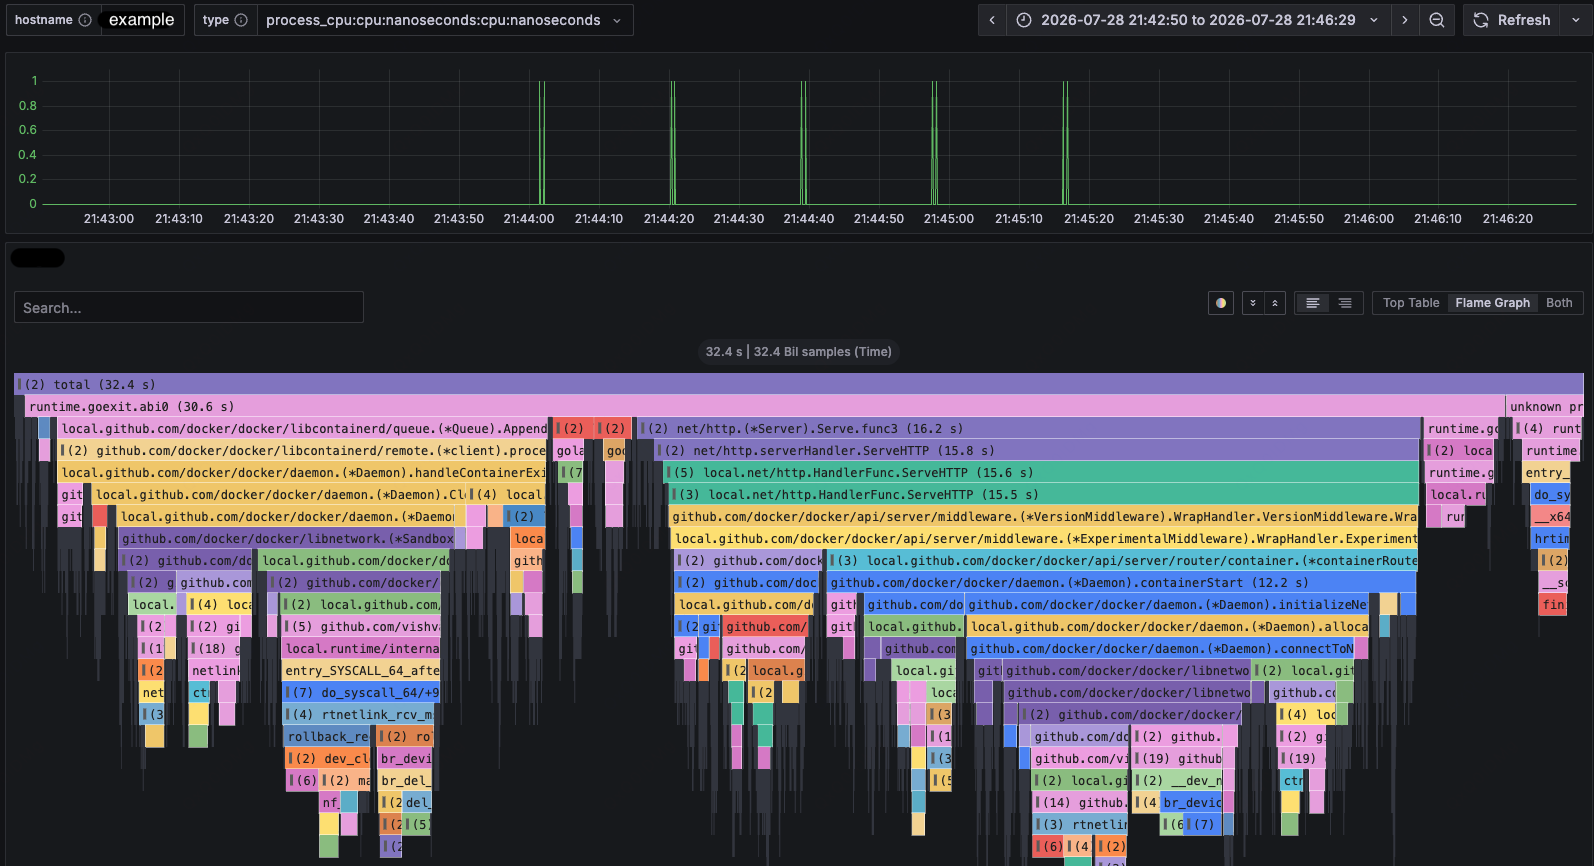
其他更多丰富维度的剖析任务参考 Profiling API。
🌐 Profiling API
huatuo-apiserver 通过 /v1/profiling 创建、监督和停止 Profiling Job。每次 HTTP
创建请求都是一次独立执行。Job 持久化在 huatuo-apiserver,Node 只维护内存中的
Operation 和 profiler 进程。
Job 控制不依赖 Elasticsearch;查询原始结果和生成 Dashboard 链接时才要求配置
Elasticsearch。Node 和 Apiserver 必须使用同一索引。
1. 请求约定
huatuo-apiserver 默认监听 :12740。以下示例使用环境变量统一设置服务地址和 Bearer token:
API_BASE="http://127.0.0.1:12740"
API_TOKEN="REPLACE_WITH_RANDOM_HEX"
每个请求必须在 Authorization 请求头中传入配置的 Bearer token:
Authorization: Bearer REPLACE_WITH_RANDOM_HEX
非管理员用户需要配置 /v1/profiling 和 /v1/profiling/** 权限。权限可带
HTTP 方法前缀,例如 GET /v1/profiling/**。成功响应仅包含 data:
错误响应包含稳定错误码和可读消息:
{
  "error": {
    "code": "result_unavailable",
    "message": "Job state does not provide a complete Profiling result"
  }
}
客户端应根据 error.code 分支处理,不应解析 error.message。
2. 查询剖析能力
创建任务前,建议先查询服务端支持的剖析类型、语言、CPU 模式、内存模式和运行参数:
curl -sS \
  -H "Authorization: Bearer ${API_TOKEN}" \
  "${API_BASE}/v1/profiling/capabilities"
data.items 是随版本发布的静态能力表,每项包含:
| 字段 |
说明 |
type |
剖析类型:cpu 或 memory |
language |
目标语言 |
modes |
此类型与语言组合允许的 mode |
supports_binary_match |
是否允许 binary_match_path |
supported_scopes |
允许的 scope |
当前 c、c++ 和 go CPU 剖析支持 oncpu、offcpu,java 和
python 仅支持 oncpu。内存剖析支持以下组合:
| 语言 |
mode |
说明 |
c、c++、go |
virtual_alloc |
虚拟地址空间分配 |
c、c++、go |
physical_alloc |
物理页分配 |
c、c++、go |
physical_usage |
当前物理页驻留 |
java |
object_alloc |
JVM 对象分配 |
java |
object_usage |
JVM 存活对象 |
3. 创建剖析任务
POST /v1/profiling 的 JSON 参数如下:
| 参数 |
是否必需 |
说明 |
type |
是 |
剖析类型:cpu 或 memory |
language |
是 |
目标进程语言,必须与剖析类型匹配 |
mode |
是 |
能力表为对应类型和语言声明的模式 |
duration_seconds |
是 |
采集时长,单位为秒 |
hostname |
是 |
运行目标进程的节点主机名,用于任务调度 |
scope |
是 |
能力表允许的 host 或 container |
container_id |
container 范围必需 |
目标容器 ID |
binary_match_path |
否 |
能力表允许时使用的可执行文件路径匹配条件 |
即使请求内容相同,每次请求也会创建一个新 Job。超过每节点或进程级活动 Job
配额时返回 HTTP 429。
创建宿主机 Go CPU 剖析任务:
curl -sS -i \
  -X POST \
  -H "Authorization: Bearer ${API_TOKEN}" \
  -H "Content-Type: application/json" \
  -d '{
    "type": "cpu",
    "language": "go",
    "mode": "oncpu",
    "scope": "host",
    "duration_seconds": 60,
    "hostname": "node-01"
  }' \
  "${API_BASE}/v1/profiling"
创建容器内 Java 存活对象剖析任务:
curl -sS -i \
  -X POST \
  -H "Authorization: Bearer ${API_TOKEN}" \
  -H "Content-Type: application/json" \
  -d '{
    "type": "memory",
    "language": "java",
    "mode": "object_usage",
    "scope": "container",
    "duration_seconds": 60,
    "container_id": "9f4c2f1a8b7d",
    "hostname": "node-01"
  }' \
  "${API_BASE}/v1/profiling"
创建成功返回 201 Created,Location 响应头指向新任务,响应体包含后续查询所需的任务 ID:
{
  "data": {
    "request_id": "<profile-job-id>",
    "hostname": "node-01",
    "duration_seconds": 60,
    "scope": "host",
    "type": "cpu",
    "language": "go",
    "mode": "oncpu",
    "status": "pending",
    "created_at": "2026-08-24T10:00:00Z",
    "updated_at": "2026-08-24T10:00:00Z"
  }
}
JOB_ID="<profile-job-id>"
4. 查询任务列表
GET /v1/profiling 支持以下查询参数:
| 参数 |
默认值 |
说明 |
limit |
100 |
每页数量,取值范围为 1 到 1000 |
offset |
0 |
起始偏移量,必须大于或等于 0 |
查询最新的 20 个 Profiling Job:
curl -sS -G \
  -H "Authorization: Bearer ${API_TOKEN}" \
  --data-urlencode "limit=20" \
  --data-urlencode "offset=0" \
  "${API_BASE}/v1/profiling"
服务端固定只返回 Profiling Job,并按 created_at 倒序排列。data.items
是任务数组,data.limit 和 data.offset 是实际使用的分页参数;
data.has_more 表示是否还有下一页。非管理员只能查看自己创建的任务。
5. 查询单个任务
curl -sS \
  -H "Authorization: Bearer ${API_TOKEN}" \
  "${API_BASE}/v1/profiling/${JOB_ID}"
任务信息位于 data 字段:
| 字段 |
说明 |
request_id |
后续所有请求使用的 Profiling Job ID |
container_id |
目标容器 ID;宿主机任务不返回该字段 |
hostname |
目标节点主机名 |
duration_seconds |
请求的剖析时长,单位为秒 |
scope |
host 或 container |
type |
cpu 或 memory |
language |
目标进程语言 |
mode |
从能力表中选择的剖析模式 |
binary_match_path |
可执行文件匹配路径;未使用时不返回该字段 |
status |
当前任务状态 |
terminal |
终态详情 {outcome, reason, message};非终态不返回 |
created_at |
任务创建时间 |
updated_at |
Job 状态最后更新时间 |
started_at |
实际开始执行时间;尚未观察到运行时不返回 |
ended_at |
进入终态的时间;运行期间不返回 |
result_url |
完整结果可用时,由单任务详情接口返回的 Dashboard 链接 |
任务状态流转如下:
| 状态 |
说明 |
pending |
任务已创建,正在等待 Agent 执行 |
running |
Agent 正在采集剖析数据 |
stopping |
停止意图已持久化,正在异步执行停止操作 |
terminal |
任务已结束,具体结果见 terminal.outcome |
terminal.outcome 可取 completed、failed、stopped 或
unknown。failed 时通过 terminal.reason 和 terminal.message 定位原因;
stopped 表示主动停止,结果可能不完整;unknown 表示 Apiserver 无法确认
Operation 最终状态,但持久发布的结果仍可能可用。
operation_lost 和 execution_timed_out 是 terminal.reason 的原因码,不是 Job
状态。其他失败原因包括等待启动或停止超时、Node 不可用、执行容量超过上限、
启动或执行失败、表示 Apiserver 构造的 Node 请求无效的
invalid_node_request,以及协议错误。
6. 获取原始剖析数据
GET /v1/profiling/:request_id/raw 仅在持久发布标记仍存在时返回
terminal.outcome 为 completed 或 unknown 的 Job 原始剖析窗口。发布标记
不存在或已经过期时返回 result_not_found。活动状态返回 result_not_ready;
failed 和 stopped 返回
result_unavailable。
数据量可能较大,可以直接保存到文件:
curl -sS \
  -H "Authorization: Bearer ${API_TOKEN}" \
  -o profile-raw.json \
  "${API_BASE}/v1/profiling/${JOB_ID}/raw?limit=100&offset=0"
剖析窗口位于响应体的 data.items 字段;data.limit、data.offset
和 data.has_more 描述分页。每条记录包含 uploaded_timestamp、started_timestamp、
profile_type 和兼容 pprof 的 profile 数据。
已持久发布但内容为空的结果仍返回成功,items 为空数组。显式 limit=0 返回参数
错误;只有未传 limit 才使用默认值。limit 默认值为 20,
最大值为 100。编码后的 Profile 数据超过 64 MiB 时返回
413 result_too_large,调用方应减小 limit 后重试。
火焰图每批读取并合并 100 个窗口,每次请求总上限为 100000 个窗口。一小时每秒产生
一个窗口时,全部 3600 个窗口都会参与合并。超过 100000 个窗口时返回错误,提示缩小
时间范围或过滤条件;查询或合并失败都不返回部分火焰图。原始 Profile 列表仍按 Job
查询,其每页上限不限制完整火焰图的聚合数量。
7. 停止任务
停止是异步意图,pending、running 或已经处于 stopping 的 Job 均可接收:
curl -sS \
  -X POST \
  -H "Authorization: Bearer ${API_TOKEN}" \
  "${API_BASE}/v1/profiling/${JOB_ID}/stop"
成功返回 200 OK 和当前 Job 快照。终态 Job 返回 409 Conflict。由于结果可能
不完整,stopped Job 不提供结果查询。
📖 profiler 命令行功能概述
profiler 是 HUATUO 提供的独立性能剖析命令行工具。它可以直接对宿主机进程或容器内进程采样,不依赖 huatuo-apiserver、Elasticsearch 或 Grafana。工具支持 C、C++、Go、Java 和 Python 进程,并将调用栈输出为折叠栈或 SVG 火焰图。
C、C++ 和 Go 使用基于 eBPF 的原生采集器,可观测 on-CPU、off-CPU 阻塞与调度延迟、虚拟内存分配、物理内存分配和物理内存驻留。Java 通过 async-profiler 观测 CPU、对象分配和存活对象;Python 通过 py-spy 观测 CPU。采集结果适合用于热点函数定位、内存增长归因、容器内进程分析和性能问题现场留存。
本节以下介绍 _output/bin/profiler 的独立使用方式。服务化的持续 Profiling 使用方式见上方 Profiling API。
🎯 应用场景
1. CPU 热点与调用路径定位
对 C、C++、Go、Java 或 Python 进程按固定频率采样调用栈,通过栈宽度判断 CPU 时间的主要消耗路径。原生采集器还可以使用 --cpuid 将采样限定到指定 CPU,以分析绑核任务或局部 CPU 热点。
2. 原生进程内存归因
对 C、C++ 和 Go 进程分别观测虚拟地址空间分配、物理页分配和当前物理页驻留。三种模式区分“申请了多少地址空间”“实际分配了多少物理页”和“当前仍驻留多少物理页”,用于定位 mmap、缺页分配和常驻内存增长的调用路径。
3. JVM 对象分配与存活对象分析
通过 async-profiler 采集 Java 对象分配或存活对象调用栈。对象分配适合定位高分配速率和 GC 压力来源;存活对象适合分析采集窗口内仍被引用的对象及其分配路径。
4. 容器与多进程任务分析
通过容器 ID 自动解析容器内目标进程,适合 Docker 和 containerd 工作负载。Java 和 Python 还支持逗号分隔的多个 PID,并可限制同时运行的采集子进程数量,适用于同一服务的多实例或父子进程分析。
🛠️ 功能使用
1. 构建与运行条件
在仓库根目录构建完整产物:
生成的命令位于 _output/bin/profiler。原生采集依赖 Linux eBPF、perf event 和仓库构建出的 BPF 对象,通常需要 root 权限,并要求 kernel.perf_event_paranoid 允许采样。Java 需要 async-profiler,--tool-path 指向统一工具根目录,其中包含 bin/asprof 和 lib/libasyncProfiler.so。Python 使用同一根目录下的 py-spy。
查看当前版本的完整帮助:
_output/bin/profiler --help
命令的基本结构如下:
sudo _output/bin/profiler \
  --type <cpu|memory> \
  --language <c|c++|go|java|python> \
  --pid <pid> \
  --duration 30 \
  --aggr-interval 10 \
  --output-format flamegraph \
  --output-path ./profiles
--type 和 --language 为必填参数。Java、Python 和原生内存采集必须在 --pid 与 --container-id 中指定且仅指定一个目标;原生 CPU 采集未指定目标时可进行宿主机级采样。
2. 通用命令参数
| 参数 |
默认值 |
适用范围 |
说明 |
--type, -t |
无 |
全部 |
观测类型:cpu 或 memory,必填 |
--language, -l |
无 |
全部 |
目标语言:c、c++、go、java 或 python,必填 |
--pid, -p |
无 |
全部 |
目标 PID;Java、Python 可使用逗号分隔多个 PID,原生采集最多一个 PID |
--container-id |
无 |
全部 |
目标容器 ID;不能与 --pid 同时使用 |
--duration, -d |
10 |
全部 |
总采集时长,单位为秒,最小为 1 |
--aggr-interval |
10 |
全部 |
聚合周期,单位为秒,不得大于采集时长 |
--freq, -F |
99 |
CPU |
每秒采样次数;Java 最大为 1000 |
--output-path |
. |
本地输出 |
输出目录,不是输出文件名 |
--output-format |
collapsed |
全部 |
collapsed、flamegraph、svg 或 remote |
--output-storage |
/var/run/huatuo-toolstream.sock |
remote |
远端上传使用的 Unix socket |
--max-concurrent-procs |
0 |
Java、Python |
并发采集子进程上限;0 表示不限制 |
--tool-path |
无 |
Java、Python |
外部采集工具统一根目录,必填 |
--binary-match-path |
无 |
Java、Python |
按可执行文件路径匹配容器内目标进程 |
--huatuo-api-address |
127.0.0.1:19704 |
容器目标 |
用于解析容器元数据的 HUATUO API 地址 |
--tracer-id |
空;本地输出时内部生成 |
全部;remote 必填 |
toolstream 和远端存储共用的稳定采集任务 ID |
--enable-pprof |
false |
工具自身 |
在 :6000 暴露 profiler 进程自身的 Go pprof 接口 |
--version-format |
text |
版本查询 |
--version 的输出格式:text、json 或 short |
--help, -h |
- |
全部 |
显示命令帮助 |
--version, -v |
- |
全部 |
显示版本与构建信息 |
原生采集专用参数:
| 参数 |
默认值 |
适用范围 |
说明 |
--memory-mode |
无 |
原生内存、Java 内存 |
内存观测维度;使用 --type memory 时必填 |
--cpuid |
全部 CPU |
原生 CPU |
CPU 列表或范围;off-CPU 样本按任务切出时所在 CPU 过滤 |
--cpu-mode |
oncpu |
原生 CPU |
oncpu 按频率采样,offcpu 归因阻塞与可运行调度延迟 |
--require-hardware-pmu |
false |
原生 on-CPU |
强制使用硬件 PMU 采样;不可用时失败,不回退软件 CPU clock |
--offcpu-phase |
all |
原生 off-CPU |
累计 all、blocked 或 runqueue 时间 |
--offcpu-min-duration-us |
1000 |
原生 off-CPU |
丢弃持续时间小于该微秒数的阶段 |
--offcpu-stats |
false |
原生 off-CPU |
收集 BPF 诊断统计;错误和清理路径会产生额外开销 |
--thread-group |
false |
原生 |
同时采集目标 PID 所在线程组中的其他线程 |
--physical-memory-probability |
100 |
原生物理内存 |
物理内存事件采样概率,范围为 1~100 |
--log-bpf-debug |
false |
原生 |
输出 BPF 调试事件,常规采集不建议启用 |
日志参数:
| 参数 |
默认值 |
说明 |
--log-level |
error |
trace、debug、info、warn 或 error |
--log-file |
stdout |
日志文件路径,或 stdout |
--log-size |
100 |
日志轮转大小,单位 MB;0 表示不轮转,仅用于文件输出 |
--verbose |
false |
等价于 --log-level debug --log-file stdout,并覆盖显式日志设置 |
3. C、C++ 和 Go 观测
C、C++ 和 Go 均使用原生 eBPF 采集器,命令只需替换 --language。CPU 模式按采样次数统计调用栈宽度,同时包含可解析的用户态栈和内核态栈。
sudo _output/bin/profiler \
  --type cpu \
  --language go \
  --pid 12345 \
  --duration 30 \
  --aggr-interval 10 \
  --freq 99 \
  --output-format flamegraph \
  --output-path ./profiles/go-cpu
如需包含同一进程的工作线程,增加 --thread-group。如需限定 CPU,增加 --cpuid 2,4-7。原生 CPU 也支持容器和宿主机级采样:
原生 on-CPU 采集优先使用硬件 CPU cycle event;硬件 PMU 不可用时回退软件
CPU clock。两种采样源下 --freq 均表示每秒采样次数。若软件时钟回退会掩盖
IRQ 关闭期间的 CPU 时间,可指定 --require-hardware-pmu。
# 采集指定容器
sudo _output/bin/profiler \
  --type cpu --language c --container-id <container-id> \
  --duration 30 --aggr-interval 10 \
  --output-format collapsed --output-path ./profiles/container

# 不指定 PID 或容器,采集宿主机
sudo _output/bin/profiler \
  --type cpu --language c \
  --duration 30 --aggr-interval 10 \
  --output-format flamegraph --output-path ./profiles/host
如需把线程离开 CPU 的时间归因到触发切出的调用路径,使用 off-CPU 模式:
sudo _output/bin/profiler \
  --type cpu --language go --pid 12345 --thread-group \
  --cpu-mode offcpu --offcpu-phase all \
  --cpuid 2,4-7 \
  --offcpu-min-duration-us 1000 \
  --duration 30 --aggr-interval 10 \
  --output-format flamegraph --output-path ./profiles/go-offcpu
off-CPU 是事件驱动采集,因此不使用 --freq。指定 --cpuid 时,仅记录任务从目标 CPU 切出后开始的区间;后续在其他 CPU 唤醒或切入不会改变该归属。火焰图直接以纳秒为数值,并增加 off-CPU blocked、scheduling delay (preempted)、scheduling delay (yielded) 等根节点。all 阶段同时累计阻塞与 runqueue 等待时间,但仍按这些根节点分开显示。采集端使用单一稳定的 BPF stack map,避免长时间睡眠跨越多轮读取后被错误解析到另一代栈。
原生内存支持以下维度:
--memory-mode |
统计内容 |
适用问题 |
virtual_alloc |
虚拟地址空间分配量及其调用栈 |
mmap 等虚拟内存申请过多、地址空间增长 |
physical_alloc |
采集窗口内新分配的物理内存量 |
缺页触发的物理页分配热点、分配速率分析 |
physical_usage |
采集时仍驻留的物理内存量 |
常驻内存来源、物理页未释放路径 |
sudo _output/bin/profiler \
  --type memory \
  --language c++ \
  --memory-mode physical_usage \
  --pid 12345 \
  --thread-group \
  --physical-memory-probability 100 \
  --duration 30 \
  --aggr-interval 10 \
  --output-format flamegraph \
  --output-path ./profiles/native-memory
--physical-memory-probability 仅适用于 physical_alloc 和 physical_usage。降低该值可减少高频内存事件的处理量,但火焰图中的值由采样事件估算,不再是逐事件统计。
4. Java 观测
Java CPU 采集依赖 async-profiler。单 PID、容器和多 PID 均可使用:
_output/bin/profiler \
  --type cpu \
  --language java \
  --pid 12345,12346 \
  --tool-path /opt/huatuo/tools \
  --max-concurrent-procs 2 \
  --duration 30 \
  --aggr-interval 10 \
  --freq 99 \
  --output-format flamegraph \
  --output-path ./profiles/java-cpu
Java 内存支持两个维度:
--memory-mode |
统计内容 |
适用问题 |
object_alloc |
采集窗口内的对象分配及分配调用栈 |
高分配速率、短命对象和 GC 压力来源 |
object_usage |
存活对象及其分配调用栈 |
长生命周期对象、堆占用来源和疑似内存泄漏 |
_output/bin/profiler \
  --type memory \
  --language java \
  --memory-mode object_usage \
  --pid 12345 \
  --tool-path /opt/huatuo/tools \
  --duration 30 \
  --aggr-interval 10 \
  --output-format flamegraph \
  --output-path ./profiles/java-memory
使用容器 ID 时,将 --pid 替换为 --container-id <container-id>。如果容器内存在多个候选进程,可通过 --binary-match-path 指定目标可执行文件路径。
5. Python 观测
Python 当前仅支持 CPU 观测。--aggr-interval 必须与 --duration 相等,即一次采集只生成一个聚合窗口。--tool-path 指向包含 py-spy 的统一工具根目录。
_output/bin/profiler \
  --type cpu \
  --language python \
  --pid 12345,12346 \
  --tool-path /opt/huatuo/tools \
  --max-concurrent-procs 2 \
  --duration 30 \
  --aggr-interval 30 \
  --freq 99 \
  --output-format flamegraph \
  --output-path ./profiles/python-cpu
Python 不支持 --type memory。若需要 Python 内存分析,应使用独立的内存分析工具;当前 profiler 命令不会调用 memray 生成 Python 内存结果。
6. 火焰图与输出格式选择
| 格式 |
生成内容 |
选择建议 |
collapsed |
perf_<Unix 时间戳>.folded;每行是以分号分隔的调用栈及末尾计数 |
用于脚本检索、结果比较,或交给其他火焰图工具二次渲染 |
flamegraph |
flamegraph_<Unix 时间戳>.svg;内嵌交互脚本的 SVG |
默认的人工分析格式,可在浏览器中搜索、缩放和查看栈帧数值 |
svg |
与 flamegraph 相同的交互式 SVG |
兼容显式要求 SVG 的调用方;当前实现与 flamegraph 等价 |
remote |
不生成本地火焰图,通过 Unix socket 上传 pprof 兼容数据 |
接入 HUATUO 存储链路时使用,不适合离线查看 |
火焰图从下到上表示调用方向,矩形宽度表示该调用栈在当前观测维度中的累计值。不同类型的宽度含义不同:CPU 表示采样次数折算的 CPU 时间占比;内存模式表示相应的虚拟分配、物理分配、物理驻留、Java 对象分配或存活对象量。横向位置不表示时间先后。
折叠栈示例:
main;handleRequest;parsePayload 428
main;handleRequest;writeResponse 172
需要保留原始数据并支持后续使用不同配色或过滤规则重新渲染时,选择 collapsed。只需直接定位热点时,选择 flamegraph。remote 依赖 HUATUO toolstream Unix socket,要求提供非空的 --tracer-id,独立离线使用时不应选择该格式。
7. 根据集成测试复现
仓库集成测试提供了可执行的端到端示例。测试会创建目标进程、运行 profiler,并校验输出中的预期调用栈:
# 原生 CPU
sudo ./integration/run.sh test_profiler_native_cpu.sh

# 原生 off-CPU 阻塞与调度延迟
sudo ./integration/run.sh test_profiler_native_cpu_offcpu.sh

# 原生虚拟内存与物理内存
sudo ./integration/run.sh test_profiler_native_memory_virtual_alloc.sh
sudo ./integration/run.sh test_profiler_native_memory_physical_usage.sh

# Java CPU 与内存
sudo ./integration/run.sh test_profiler_java_cpu_multi_pid.sh
sudo ./integration/run.sh test_profiler_java_memory_usage_alloc.sh

# Python 多进程 CPU
sudo ./integration/run.sh test_profiler_python_cpu_multi_pid.sh
容器、线程组和指定 CPU 的示例分别位于 test_profiler_native_cpu_container.sh、test_profiler_native_cpu_thread_group.sh 和 test_profiler_native_cpu_cpuid.sh。运行前需完成 make build,并根据 integration/env.sh 配置 Java 或 Python 采集工具路径。
⚙️ 功能原理介绍
profiler 先根据语言和观测类型选择采集器。原生 on-CPU 采集器将 eBPF 程序挂载到 perf event;off-CPU 模式挂载调度切换、唤醒、退出和任务释放 tracepoint;原生内存采集器通过内核事件记录分配与释放路径;Java 和 Python 采集器分别启动 async-profiler 和 py-spy 子进程。采集记录进入统一聚合流水线,按调用栈合并计数,最后写入本地文件或上传远端存储。
flowchart LR
    CLI[profiler 命令参数] --> Select{语言与观测类型}
    Select -->|C/C++/Go| Native[eBPF 原生采集器]
    Select -->|Java| Java[async-profiler]
    Select -->|Python| Python[py-spy]
    Native --> Queue[采样记录队列]
    Java --> Queue
    Python --> Queue
    Queue --> Aggregate[按调用栈聚合]
    Aggregate --> Folded[collapsed 折叠栈]
    Aggregate --> SVG[交互式 SVG 火焰图]
    Aggregate --> Remote[Unix socket 远端上传]
--duration 控制采集生命周期,--aggr-interval 控制远端上传的快照周期。本地 collapsed、flamegraph 和 svg 在采集结束时写出最终聚合结果;remote 按聚合周期生成并上传快照。队列将采集与符号化、聚合和输出解耦,避免文件渲染阻塞采样路径。
🌟 结尾
6.1 - 存储服务
🎯 关于 HUATUO(华佗)
HUATUO(华佗)是由滴滴开源并依托 CCF(中国计算机学会)孵化的操作系统深度观测项目,专注为云原生通用计算、AI 计算、云服务、基础服务等提供操作系统内核级深度观测能力。
📖 概述
HUATUO(华佗)支持将采集到的 Linux 内核事件与 AutoTracing 数据持久化写入外部存储后端。当前支持 Elasticsearch 和 OpenSearch 两种存储系统。
采集到的事件在序列化为 JSON 后,同时写入节点本地目录(huatuo-local/)和配置的远端存储后端。本地目录保留事件的本地副本,远端存储提供持久化与结构化查询能力。
本文介绍 Elasticsearch 和 OpenSearch 的配置与验证方法。示例基于 Docker 部署,生产环境只需将地址替换为实际服务地址,配置方式一致。
🎯 应用场景
Kubernetes 云原生故障溯源
容器化环境中,Pod OOM、节点 Hung Task 等内核事件具有短暂性,日志往往在事件发生后被清理。将事件写入 Elasticsearch 或 OpenSearch 后,运维团队可按时间范围查询历史异常时间线,在事后复盘阶段精确定位间歇性故障的根因。
AI 计算集群稳定性审计
GPU 训练集群长期运行过程中,ras 硬件错误、iotracing I/O 延迟等事件的历史分布对容量规划和硬件健康评估至关重要。将采集数据持久化后,可通过聚合查询建立节点稳定性基线,为主动维护提供数据依据。
合规与事件留存
等保合规要求系统异常事件具备可追溯性。将 HUATUO 采集的内核事件写入 OpenSearch 并配置索引生命周期策略,可满足对事件留存周期和查询能力的合规要求。
可观测性平台集成
Elasticsearch 和 OpenSearch 均提供与 Grafana 的原生数据源对接能力。将 HUATUO 事件写入存储后,可在 Grafana 中构建内核事件趋势面板,与应用层指标叠加展示,实现历史数据分析与告警回顾。
💎 价值
| 维度 |
仅本地存储 |
接入外部存储后端 |
| 数据持久性 |
受节点磁盘容量限制,重启后可能丢失 |
数据持久化至分布式存储,支持长期保留 |
| 查询能力 |
无结构化查询,依赖文件搜索 |
支持全文检索、字段过滤、时间范围聚合 |
| 可视化集成 |
不支持 |
可直接对接 Grafana、Kibana 等可视化平台 |
| 多节点汇聚 |
数据分散在各节点本地 |
集中写入统一存储,支持跨节点查询 |
| 合规留存 |
难以满足留存周期要求 |
可配置索引生命周期策略,满足合规留存要求 |
🚀 使用
OpenSearch V2
1. 部署 OpenSearch
docker pull opensearchproject/opensearch:2.6.0
docker run -d --name opensearch --network host \
    -e "discovery.type=single-node" \
    opensearchproject/opensearch:2.6.0
2. 验证服务状态
curl -k -u admin:admin https://localhost:9200
返回示例:
{
  "name" : "22ca72df78c0",
  "cluster_name" : "docker-cluster",
  "cluster_uuid" : "yxb3foceQVKzXXO6bHpPHQ",
  "version" : {
    "distribution" : "opensearch",
    "number" : "2.6.0",
    "build_type" : "tar",
    "build_hash" : "7203a5af21a8a009aece1474446b437a3c674db6",
    "build_date" : "2023-02-24T18:57:04.388618985Z",
    "build_snapshot" : false,
    "lucene_version" : "9.5.0",
    "minimum_wire_compatibility_version" : "7.10.0",
    "minimum_index_compatibility_version" : "7.0.0"
  },
  "tagline" : "The OpenSearch Project: https://opensearch.org/"
}
若验证失败,可通过以下命令查看容器日志:
3. 配置 huatuo-bamai
在 huatuo-bamai.conf 中添加以下配置。OpenSearch 容器镜像默认用户名和密码均为 admin。存储配置的详细说明请参见配置指南。
[Storage.Elasticsearch]
    Address = "https://127.0.0.1:9200"
    Index = "huatuo_bamai"
    Username = "admin"
    Password = "admin"
4. 启动 huatuo-bamai
通过 --config-dir 指定配置文件所在目录:
./_output/bin/huatuo-bamai --region dev --config-dir .
当本地存储目录 huatuo-local/ 中生成文件(例如 net_rx_latency)时,说明已成功采集到内核事件。可使用以下命令从 OpenSearch 查询数据:
curl -k -u admin:admin \
    -X GET "https://localhost:9200/huatuo_bamai/_search?pretty" \
    -H "Content-Type: application/json" \
    -d '{"query": {"match_all": {}}}'
返回示例:
{
    "_index" : "huatuo_bamai",
    "_id" : "yjPG_50Bu_OF-hukxKR7",
    "_score" : 1.0,
    "_source" : {
      "hostname" : "hostname",
      "region" : "dev",
      "uploaded_timestamp" : "2026-05-07T00:11:49.753166222Z",
      "tracer_name" : "net_rx_latency",
      "observed_timestamp" : "2026-05-07T00:11:49.753166222Z",
      "tracer_type" : "event",
      "tracer_data" : {
        "comm" : "<nil>",
        "pid" : 0,
        "latency_stage" : "RX_STAGE_NETIF",
        "latency_ms" : 1776078133565,
        "tcp_saddr" : "127.0.0.1",
        "tcp_daddr" : "127.0.0.1",
        "tcp_sport" : 37736,
        "tcp_dport" : 9200,
        "tcp_seq" : 1080592402,
        "tcp_ack_seq" : 2465063876,
        "packet_len_bytes" : 781
      }
    }
}
查看文档记录总数,不查看具体列表。
curl -k -u admin:admin -X GET "https://localhost:9200/huatuo_bamai/_count?pretty"
返回示例:其中 count 数字 = 写入记录的总数。
{
  "count" : 2680,
  "_shards" : {
    "total" : 1,
    "successful" : 1,
    "skipped" : 0,
    "failed" : 0
  }
}
Elasticsearch V8
1. 部署 Elasticsearch
docker pull docker.elastic.co/elasticsearch/elasticsearch:8.15.5
docker run -d --name elasticsearch --network host \
    -e "discovery.type=single-node" \
    -e "ES_JAVA_OPTS=-Xms1g -Xmx1g" \
    -e "ELASTIC_PASSWORD=123456" \
    docker.elastic.co/elasticsearch/elasticsearch:8.15.5
2. 验证服务状态
curl -k -u elastic:123456 https://localhost:9200
返回示例:
{
  "name" : "ab0b562f8dbd",
  "cluster_name" : "docker-cluster",
  "cluster_uuid" : "aVfOVgJTQXuhZ3HGotK3ww",
  "version" : {
    "number" : "8.15.5",
    "build_flavor" : "default",
    "build_type" : "docker",
    "build_hash" : "b10896bcfe167cce44a84ba2771d101fb596d40d",
    "build_date" : "2024-11-21T22:06:13.985834967Z",
    "build_snapshot" : false,
    "lucene_version" : "9.11.1",
    "minimum_wire_compatibility_version" : "7.17.0",
    "minimum_index_compatibility_version" : "7.0.0"
  },
  "tagline" : "You Know, for Search"
}
3. 配置 huatuo-bamai
在 huatuo-bamai.conf 中添加以下配置。Elasticsearch 容器镜像默认用户名为 elastic,密码通过环境变量 ELASTIC_PASSWORD 设置。存储配置的详细说明请参见配置指南。
[Storage.Elasticsearch]
    Address = "https://127.0.0.1:9200"
    Index = "huatuo_bamai"
    Username = "elastic"
    Password = "123456"
4. 启动 huatuo-bamai
通过 --config-dir 指定配置文件所在目录:
./_output/bin/huatuo-bamai --region dev --config-dir .
当本地存储目录 huatuo-local/ 中生成文件(例如 net_rx_latency)时,说明已成功采集到内核事件。可使用以下命令从 Elasticsearch 查询数据:
curl -k -u elastic:123456 \
    -X GET "https://localhost:9200/huatuo_bamai/_search?pretty" \
    -H "Content-Type: application/json" \
    -d '{"query": {"match_all": {}}}'
返回示例:
{
    "_index" : "huatuo_bamai",
    "_id" : "WtNZAJ4BQ8x-thPHEY1i",
    "_score" : 1.0,
    "_source" : {
      "hostname" : "hostname",
      "region" : "dev",
      "uploaded_timestamp" : "2026-05-07T02:51:37.696263325Z",
      "tracer_name" : "net_rx_latency",
      "observed_timestamp" : "2026-05-07T02:51:37.696263325Z",
      "tracer_type" : "event",
      "tracer_data" : {
        "comm" : "<nil>",
        "pid" : 0,
        "latency_stage" : "RX_STAGE_NETIF",
        "latency_ms" : 1776078133565,
        "tcp_saddr" : "127.0.0.1",
        "tcp_daddr" : "127.0.0.1",
        "tcp_sport" : 2379,
        "tcp_dport" : 36706,
        "tcp_seq" : 950542706,
        "tcp_ack_seq" : 1960972383,
        "packet_len_bytes" : 91
      }
    }
}
查看文档记录总数,不查看具体列表。
curl -k -u elastic:123456 -X GET "https://localhost:9200/huatuo_bamai/_count?pretty"
返回示例:其中 count 数字 = 写入记录的总数。
{
  "count" : 2680,
  "_shards" : {
    "total" : 1,
    "successful" : 1,
    "skipped" : 0,
    "failed" : 0
  }
}
Elasticsearch V7
V7 默认使用 HTTP,因此只需要在访问服务时替换为 HTTP 即可。
1. 部署 Elasticsearch
docker pull docker.elastic.co/elasticsearch/elasticsearch:7.10.1
docker run -d --name elasticsearch --network host \
    -e "discovery.type=single-node" \
    -e "ES_JAVA_OPTS=-Xms1g -Xmx1g" \
    -e "ELASTIC_PASSWORD=123456" \
    docker.elastic.co/elasticsearch/elasticsearch:7.10.1
2. 验证服务状态
curl -k -u elastic:123456 http://localhost:9200
返回示例:
{
  "name" : "d88c9e8df48b",
  "cluster_name" : "docker-cluster",
  "cluster_uuid" : "_ZZefWx4SniAc255t_lIVg",
  "version" : {
    "number" : "7.10.1",
    "build_flavor" : "default",
    "build_type" : "docker",
    "build_hash" : "1c34507e66d7db1211f66f3513706fdf548736aa",
    "build_date" : "2020-12-05T01:00:33.671820Z",
    "build_snapshot" : false,
    "lucene_version" : "8.7.0",
    "minimum_wire_compatibility_version" : "6.8.0",
    "minimum_index_compatibility_version" : "6.0.0-beta1"
  },
  "tagline" : "You Know, for Search"
}
3. 配置 huatuo-bamai
[Storage.Elasticsearch]
    Address = "http://127.0.0.1:9200"
    Index = "huatuo_bamai"
    Username = "elastic"
    Password = "123456"
4. 启动 huatuo-bamai
通过 --config-dir 指定配置文件所在目录:
./_output/bin/huatuo-bamai --region dev --config-dir .
当本地存储目录 huatuo-local/ 中生成文件(例如 net_rx_latency)时,说明已成功采集到内核事件。可使用以下命令从 Elasticsearch 查询数据:
curl -k -u elastic:123456 \
    -X GET "http://localhost:9200/huatuo_bamai/_search?pretty" \
    -H "Content-Type: application/json" \
    -d '{"query": {"match_all": {}}}'

或者:
curl -k -u elastic:123456 \
    -X GET "http://localhost:9200/huatuo_bamai/_count?pretty"
⚙️ 原理
系统架构
HUATUO Storage 模块部署在节点上,将采集到的内核事件同时写入本地目录和 Elasticsearch 或 OpenSearch。两种存储后端共用同一套 [Storage.Elasticsearch] 配置接口,通过地址区分。
写入远端时使用 ES/OpenSearch 的 Bulk API(_bulk):事件先进入节点内的批量缓冲,由后台 worker 按"大小或时间"的阈值聚合后一次提交多条记录,并在传输层失败时按策略自动重试。
graph TB
    subgraph kernel["Linux 内核"]
        K1[内核事件]
        K2[AutoTracing]
    end

    subgraph huatuo["HUATUO Agent(节点级)"]
        T["采集层"]
        L["本地目录\nhuatuo-local/"]
        S["Storage 模块\nBulkIndexer 缓冲"]
    end

    subgraph backends["存储后端"]
        ES[Elasticsearch]
        OS[OpenSearch]
    end

    kernel --> T
    T --> L
    T --> S
    S -->|Bulk API + 自动重试| ES
    S -->|Bulk API + 自动重试| OS
过滤条件语义
内部存储查询 API 使用 AND 组合过滤条件。SQLite 和 Elasticsearch 对非 null
标量值采用以下约定:
| 操作符 |
含义 |
OpEq、OpNe |
相等/不等;缺失和 null 值均不匹配 |
OpGt、OpGte、OpLt、OpLte |
严格/包含边界的范围比较 |
OpIn |
属于非空切片或数组中的标量值 |
OpExists、OpNotExists |
存在/不存在非 null 的可查询值;不设置 Value |
空字符串是字面值:OpEq("") 匹配空字符串;OpNe("") 要求字符串存在、非 null
且非空。查询缺失字段应使用 OpNotExists,OpEq("") 不再表示字段缺失。
主机 profiling 查询改用 container_hostname 的 OpNotExists,保留原有筛选行为。
比较值支持 Go 内建字符串、布尔、整数及有限浮点数,范围比较不接受布尔值。
time.Time 和 timeutil.Timestamp 统一转为保留九位小数的 UTC 字符串,
OpIn 元素也采用相同规则。nil、指针、对象、嵌套集合及非有限数值返回
driver.ErrInvalidQuery。整数范围边界保留原始 JSON 精度,实际支持的数值范围
仍受后端和字段映射约束。
Elasticsearch 调用方必须指定实际用于精确比较的索引字段:keyword 映射使用
原字段;text 映射使用明确配置的 keyword 子字段,例如 hostname.keyword。
后端不会猜测子字段,也不会将 text 与 keyword 查询进行 OR 组合。
OpNe 对同一字段执行 exists 和 must_not term。全文匹配和数组整体相等
不属于这里的标量比较约定。
Elasticsearch 的存在性判断针对索引值,而不是 _source 中是否包含键。
ignore_above、null_value 和 normalizer 等映射设置可能改变存在性或相等行为。
要求与 SQLite 一致时,应使用保留目标标量语义的映射。日期字段不能与空字符串
比较;表达“已有日期值”时应使用存在性操作符。
数据写入流程
采集层调用 Save 后立即返回,事件落入 BulkIndexer 缓冲;后台 worker 在满足"字节阈值 / 时间阈值 / 进程退出"任一条件时将批次提交至远端。本地目录写入是同步落盘,与远端 Bulk 路径相互独立。
sequenceDiagram
    participant T as 采集层
    participant L as 本地目录(huatuo-local/)
    participant S as Storage 模块(BulkIndexer)
    participant B as ES / OpenSearch

    T->>S: 采集到内核事件,序列化为 JSON
    par 本地路径(同步)
        S->>L: 写入本地文件
    and 远端路径(异步批量)
        S->>S: 加入 Bulk 缓冲,立即返回
        Note over S: 满足 5 MB / 1 s / 退出 任一条件
        S->>B: POST /_bulk(多条记录)
        B-->>S: 200 OK + per-item 结果
        Note over S: 失败项通过 OnFailure 回调记录日志
    end
Bulk 批量写入机制
缓冲与刷新
| 参数 |
值 |
含义 |
FlushBytes |
5 MB |
缓冲累计达到该字节数立即刷新 |
FlushInterval |
1 s |
距上次刷新满 1 秒后强制刷新 |
NumWorkers |
4 |
并发提交 Bulk 请求的后台 goroutine 数 |
| 进程退出 |
Close(ctx) |
SIGTERM/SIGINT 触发,限时 10 s 内排空缓冲 |
两级重试策略
Bulk 请求的失败语义分为两层,重试范围不同:
| 层级 |
触发条件 |
处理方式 |
是否重试 |
| 整批失败 |
传输错误(连接失败、超时、TLS)
HTTP 状态:429 / 502 / 503 / 504 |
客户端按指数退避自动重试:100 ms → 200 ms → 400 ms → 800 ms,最多 3 次 |
✅ 自动 |
| 整批拒绝 |
HTTP 状态:400 / 401 / 403 / 404 / 413 等 |
不重试,整批所有记录全部丢弃,并通过 OnError 写错误日志 |
❌ 丢弃 |
| 单条失败 |
200 OK 但 per-item 失败:版本冲突、字段映射错误、文档过大 |
不重试,仅该单条丢弃,通过 OnFailure 回调记录 index/id/status/type/reason |
❌ 丢弃 |
| 单条成功 |
200 OK 且 per-item 成功 |
主分片写入成功;副本失败时记录包含索引、文档 ID 和失败分片数的警告日志 |
— |
为什么这样设计:429/5xx 与传输错误是远端短暂不可用的信号,重试有效;4xx(除 429)与 per-item 错误是客户端语义问题(数据格式、权限),重试只会放大错误,应交给开发与运维侧排查日志后修正。
分批读取
Query(ctx, query, consume) 按顺序同步调用回调,每批至少一条记录。Limit 是跳过
Offset 条匹配记录后交给回调的总条数上限。storage.Store.Query 统一校验 Limit
必须大于零、Offset 和 BatchSize 非负;后端只消费已校验的参数。
BatchSize 控制每批条数,零使用统一默认值 100,每批不超过剩余总限额。
需要数据的调用方必须明确传入正数总上限。Count 和 Values 只使用查询中的
Filters,忽略 Sorts、Limit、Offset 和 BatchSize,包括零值及负数分页参数。
Count 统计全部匹配记录;Values 使用独立的 size 参数,由 storage.Store.Values
在调用后端前校验其非负约束,后端不再重复校验这两个操作的分页参数或 size。
本地文件存储仍不支持查询。
SQLite 使用一条带 LIMIT/OFFSET 的 SELECT 逐行读取。回调期间查询占用唯一数据库
连接,不能同步再次访问同一后端。任务恢复按 ID 升序每批读取 1000 个 Job,读取关闭后
再启动监督任务,通过 ID 游标继续查询,避免任务状态变化导致偏移分页漏读。
Elasticsearch 7/8 和 OpenSearch 统一使用 Scroll 快照,支持跨越结果窗口的读取和偏移。
深偏移仍需读取并跳过前面的记录,不同 API 请求不共享快照。
各批次独立持有数据。回调、解码、后端错误或取消都会立即终止查询,已执行回调的效果
不会回滚。Scroll 使用独立的有界上下文清理,即使原查询已取消也会尝试释放资源。
查询不自动重试,因为丢失响应时 Scroll 游标可能已经前进;写入重试策略保持不变。
API 仅在未传 limit 时填默认值:Job 列表默认 100、最大 1000;原始 Profile 每页默认
20、最大 100,并保留 64 MiB 响应限制。显式零值、负数或超过上限的 limit 返回参数
错误。每页额外读取一条判断 has_more。
火焰图边读取边合并 Profile,每次查询总上限为 100000 个窗口。额外读取一条检测超限,
超限时返回错误,提示缩小时间范围或过滤条件;读取或合并失败都不返回部分火焰图。
输入批次可随处理进度释放,但合并结果的内存仍随不同调用栈数量增长。
响应错误
HTTP 成功不代表结果完整。Query 和 Values 在搜索超时或分片失败时返回错误,
Query 不交付失败批次,但此前已消费的批次不会回滚;Values 不返回部分结果。
Count 在分片失败时返回零和错误。搜索超时优先于分片失败返回。
分片错误包含失败分片总数,以及首条失败的类型、原因及嵌套原因(如果存在)。
收到成功 HTTP 响应后,DeleteByQuery 按超时、执行失败的顺序检查,
遇到首个错误即返回,同时保留响应中的已删除数量。
索引不存在时返回零且不报错,其他 HTTP 错误返回零和错误。
已完成的删除不会回滚。
直接写入和删除在副本失败时保留主分片操作成功的语义,
通过警告日志记录可用的失败详情。Bulk 写入也会报告副本失败,不重试已经成功的主分片写入。
HTTP 错误包含响应状态码和可用的 Elasticsearch 错误详情。无法识别或过大的错误响应体
以原文报告,限制为 4 KiB,并在截断时追加标记。
数据丢失场景
下列三种情况下,调用方调用 Save 时返回 nil,但事件最终未进入索引:
- 进程异常退出:
SIGKILL 或宿主机断电时,BulkIndexer 内存缓冲尚未刷新的部分直接丢失(仅本地目录保留副本)。
- 缓解:SIGTERM/SIGINT 走优雅退出路径,shutdown 时调用
Close 强制 flush,最长等待 10 秒。
- 整批被永久拒绝:4xx(非 429)类错误一次性丢弃整批所有记录。常见诱因:索引被禁用、密码失效、单条文档超过集群
http.max_content_length。
- 排查:
OnError 错误日志包含 ES 返回的 type 与 reason。
- 单条永久失败:mapping 冲突、版本冲突、文档语法错误。
- 排查:
OnFailure 错误日志按 index/id 定位失败记录。
本地目录始终保留副本:即使远端写入丢失,事件仍可从 huatuo-local/ 中找回,作为最终一致性的兜底。
解决的问题
将"逐事件 Index API"换成"BulkIndexer 批量 + 自动重试"主要解决以下四类问题:
| 问题 |
旧方案瓶颈 |
Bulk 方案的改进 |
| TLS 握手 CPU 开销 |
每事件一次 HTTPS,握手在 FIPS / RSA-PSS 下占满 CPU |
多条事件复用单连接 + 单次握手;TLS PSK ticket 缓存复用 |
| 远端 RTT 与吞吐 |
每事件一次往返,节点级写入受 RTT 限制 |
单次 Bulk 请求最多 5 MB,吞吐随批大小线性提升 |
| 远端短暂抖动 / 限流(429) |
单次失败立即丢弃,无重试 |
客户端层面自动重试,吸收瞬态故障 |
| 采集层对存储后端解耦 |
远端慢会回压采集,影响内核事件采集时延 |
异步缓冲将采集与远端写入解耦,采集路径不被网络阻塞 |
🌟 结尾
内核观测时间
事件文档可包含顶层 kernel_observed_timestamp,其值为 UTC 日期时间。
observed_timestamp 是用户态观测时刻,uploaded_timestamp 是存储写入时刻。
三者不互相补填。旧文档及没有内核时间的事件省略新增字段;历史数据不自动迁移。
原始 kernel_observed_ns 仅用于进程内事件关联,不写入新文档。
6.6 - 重传追踪
🎯 关于 HUATUO(华佗)
HUATUO(华佗)是由滴滴开源并依托 CCF(中国计算机学会)孵化的操作系统深度观测项目,广泛应用于AI 计算、AI 沙箱、云原生通用计算、云服务、基础架构服务等场景。
📖 概述
tcpshark --mode retransmit 通过内核跟踪点 tcp/tcp_retransmit_skb 和 tcp/tcp_retransmit_synack 观测 TCP 重传相关活动。显式开启 TLP 后,还会观测 tcp_send_loss_probe kprobe。根据事件类型,每条事件可携带 IP 四元组、TCP 状态、拥塞控制状态、重传计数器、序列号信息,以及用于解析容器归属的 socket 元数据。
用户态分类器根据事件类型、sk_state、ca_state 和乱序计数器生成连接阶段与原因标签。这些标签是用于运维分析的启发式分类,不是丢包根因的确定性证据。
过滤表达式由 internal/pcapfilter 在加载时编译并在内核中执行。无论是否开启 local 关联,SKB、SYN-ACK 和 TLP 三个 hook 都对同一种合成 L3 TCP 报文执行过滤。支持协议、地址、网段和端口条件;不提供以太网地址、payload、真实包长、IP/TCP options 或原始 byte-offset 语义。ether proto ip 等安全的 ethertype 判断会转换为 L3 判断。一对 IPv4-mapped IPv6 socket 地址按 IPv4 执行过滤;原始 perf record 仍保留 AF_INET6,用户态在匹配前规范化地址。local 关联模式还会把完全相同的表达式用于 embedded dropwatch。需要保留反向 ACK 或 SYN-ACK 证据时,应使用方向对称的表达式。
🎯 场景
1. TCP 网络质量与重传诊断
通过持续观测 RTO、快速重传、乱序倾向重传和 TLP 事件,识别连接建立、数据传输及连接关闭阶段的异常重传,辅助判断网络丢包、拥塞、乱序或对端不可达等问题。
2. Kubernetes 容器网络故障排查
结合容器 ID、网络命名空间和 socket cgroup 元数据定位发生重传的工作负载,并使用 --filter "tcp and port <service-port>" 聚焦特定服务流量,减少宿主机上其他连接的干扰。
3. 应用延迟与吞吐毛刺分析
将 TCP 重传事件与应用延迟、错误率和吞吐曲线对齐,分析 RTO 或连续重传是否与服务性能下降同时发生,辅助区分应用处理变慢与底层网络异常。
4. 与 dropwatch 关联定位丢包位置
使用 tcpshark local 模式在同一进程内关联重传与丢包。匹配会检查 network namespace、四元组方向、TCP sequence 或 ACK 证据及内核单调时间顺序。严格匹配表示找到了满足关联条件的丢包证据,软件或硬件来源以记录为准。no-match 保持 unknown,因为 source ready 不能证明更早的因果历史已经被观测。
🚀 使用
1. 运行 tcpshark
tcpshark --mode retransmit [flags]
| 参数 |
默认值 |
说明 |
--mode retransmit |
必填 |
选择 TCP 重传追踪模式。 |
--enable-tlp、--tlp |
关闭 |
同时挂载 tcp_send_loss_probe 并输出 TLP 事件。 |
--bpf-path <path> |
非关联模式必填 |
单个 tcp_retransmit.o 文件路径。 |
--bpf-path-dir <dir> |
关联模式必填 |
同时包含 tcp_retransmit.o 和 net_dropwatch.o 的目录。 |
--with-dropwatch |
关闭 |
加载 embedded dropwatch 并与重传关联。 |
--filter <expr> |
(无) |
三个重传 hook 共用的 L3 兼容 tcpdump 风格过滤器;local 模式下也与 embedded dropwatch 共用,见 §2。 |
--device <names> |
(无) |
与 dropwatch 相同的网卡白名单,逗号分隔;只过滤 embedded dropwatch,要求 --with-dropwatch。 |
--device-excluded <names> |
(无) |
网卡黑名单,与 --device 互斥;要求 --with-dropwatch。 |
--duration <n> |
0 |
运行 N 秒后退出(0 表示持续运行直至 Ctrl-C)。 |
--max-events-per-second <n> |
0 |
BPF 侧事件限速,0 表示不限速。 |
--output <json|text> |
text |
输出格式;设置 --output-storage 时会被忽略。 |
--output-storage <path> |
(无) |
通过 Unix socket 将事件发送给 huatuo-bamai。 |
--task-id <id> |
(无) |
toolstream 会话关联的任务 ID;必须与 --output-storage 一起使用。 |
显式同时指定 --output 和 --output-storage 时,--output 会被忽略并打印警告。
1.1 常用命令
# 文本格式输出全部重传相关事件
sudo tcpshark --mode retransmit --bpf-path bpf/tcp_retransmit.o

# NDJSON 格式输出
sudo tcpshark --mode retransmit --bpf-path bpf/tcp_retransmit.o --output json

# 在 BPF 侧过滤指定目标主机和端口的常规重传 SKB
sudo tcpshark --mode retransmit --bpf-path bpf/tcp_retransmit.o --filter "dst host 10.0.0.1 and dst port 443"

# 本地关联;两个 BPF 输入使用同一个方向对称 filter
sudo tcpshark --mode retransmit --with-dropwatch --bpf-path-dir bpf \
  --filter "tcp and port 443"

# 包含 Tail Loss Probe 事件(默认关闭)
sudo tcpshark --mode retransmit --enable-tlp --bpf-path bpf/tcp_retransmit.o

# 最多输出 100 条事件/秒;超限时打印 rate limit hit 日志
sudo tcpshark --mode retransmit --bpf-path bpf/tcp_retransmit.o \
  --max-events-per-second 100

# 在用户态过滤全部格式化事件类型,只保留目标端口 443
sudo tcpshark --mode retransmit --bpf-path bpf/tcp_retransmit.o --output json \
  | jq -c 'select(.tcp_dport == 443)'

# 运行 60 秒,仅保留分类为 RTO 的事件
sudo tcpshark --mode retransmit --bpf-path bpf/tcp_retransmit.o --duration 60 --output json \
  | jq -c 'select(.tcp_reason == "RTO")'

# 将事件转发给正在运行的 huatuo-bamai 实例
sudo tcpshark --mode retransmit --bpf-path bpf/tcp_retransmit.o \
  --output-storage /var/run/huatuo-toolstream.sock
jq -c 将每条结果压缩成单行 JSON,便于保存为 NDJSON 或继续通过管道处理。
1.2 与 huatuo-bamai 集成
tcpshark 与 dropwatch 使用相同的 --output-storage 和 toolstream 流程。通用存储方式请参考 dropwatch 文档。TCP 重传追踪增加以下配置:
[EventTracing.TCPRetransmit]
    # 两种模式都由 tcpshark 使用;默认空值。
    Filter = ""

    # 设置为 true 时传入 tcpshark --enable-tlp;默认 false。
    EnableTLP = false

    # 使用 embedded dropwatch;默认 false。
    EnableDropwatch = false

    # 传给 tcpshark --max-events-per-second;默认 100,0 表示不限速。
    MaxEventsPerSecond = 100
EventTracing.TCPRetransmit.Filter 在两种模式下都控制重传采集。关闭 local
关联时,空值不传 --filter。开启 local 关联时,规范化后的表达式同时传给
tcpshark 的两个输入,空值规范化为 tcp。EventTracing.Dropwatch.Filter
保持独立,只控制 standalone dropwatch。
tcp_retransmit tracer 默认位于全局 BlackList 中。需要启用时,应将其移除并
重启 huatuo-bamai。local 关联使用私有 dropwatch source,因此 standalone
dropwatch 可以继续位于黑名单中。
2. 过滤表达式
tcpshark 使用与 dropwatch 相同的 tcpdump 风格过滤表达式。完整语法、限制和更多示例请参考 dropwatch 文档。
# 指定目标主机和端口
--filter "dst host 10.0.0.1 and dst port 443"

# 观察两个网段之间的双向流量
--filter "(src net 10.10.0.0/16 and dst net 10.20.0.0/16) or (src net 10.20.0.0/16 and dst net 10.10.0.0/16)"
local 模式下,同一个表达式必须覆盖两个流量方向。方向性 selector 可能排除反向 ACK 或 SYN-ACK drop 证据,降低结果可信度。
local 模式拒绝 ether host 02:00:00:00:00:01 等依赖以太网地址的 primitive。ether proto ip 和 ether proto ip6 可转换为 raw-IP version 判断,因此受支持。
3. 事件数据结构
每条事件以 NDJSON 对象(types.TCPRetransmitTracing)表示。带 omitempty 标签的字段在值为空或零时不会输出。
| 字段 |
类型 |
说明 |
observed_timestamp |
string |
用户态接收/格式化事件时生成的 UTC 时间(RFC3339Nano),不是内核 hook 时间。 |
kernel_observed_timestamp |
string |
内核观测事件的 UTC 时间(RFC3339Nano),由原始单调时钟转换。 |
comm |
string |
当前内核执行上下文的进程名,不一定是 socket 所属进程。 |
pid |
uint64 |
当前执行上下文的 TGID,不一定是 socket 所属进程的 TGID。 |
container_id |
string |
huatuo-bamai 解析出的容器 ID,见 §3.2。 |
memory_cgroup_css_addr |
string |
用于解析容器归属的 socket 内存 cgroup CSS 十六进制地址。 |
net_namespace_cookie |
uint64 |
用于解析容器归属的 socket 网络命名空间 cookie。 |
net_namespace_inum |
uint32 |
用于解析容器归属的 socket 网络命名空间 inum。 |
tcp_saddr |
string |
源 IP 地址。 |
tcp_daddr |
string |
目的 IP 地址。 |
tcp_sport |
uint16 |
源端口。 |
tcp_dport |
uint16 |
目的端口。 |
tcp_state |
string |
TCP socket 状态,如 ESTABLISHED、SYN_SENT 或 NEW_SYN_RECV。 |
phase |
string |
分类结果:connect、data 或 close。 |
tcp_reason |
string |
分类结果:RTO、fast_retransmit、TLP 或 unknown。 |
event_type |
string |
tcp_retransmit_skb、tcp_retransmit_synack 或 tcp_send_loss_probe。 |
ca_state |
uint8 |
拥塞控制状态:0=Open、1=Disorder、2=CWR、3=Recovery、4=Loss。 |
icsk_retransmits |
uint8 |
当前重传计数器快照。 |
icsk_pending |
uint8 |
inet_connection_sock 中原始的待处理定时器状态,取值见下表。 |
reord_seen |
uint32 |
连接累计乱序计数器。 |
dsack_dups |
uint32 |
累计 DSACK 重复计数器。 |
tcp_seq |
uint32 |
SKB 事件使用 TCP_SKB_CB(skb)->seq;TLP 使用 snd_nxt;字段可用时 SYN-ACK 使用 request snt_isn。 |
tcp_ack_seq |
uint32 |
SKB 事件使用 tcp_sk(sk)->rcv_nxt;TLP 使用 snd_una;字段可用时 SYN-ACK 使用 request rcv_nxt。 |
tcp_end_seq |
uint32 |
SKB 事件使用 TCP_SKB_CB(skb)->end_seq;字段可用时 SYN-ACK 使用 request snt_isn + 1;TLP 中省略。 |
tcp_flags |
string |
渲染后的 TCP flag 集合,如 `SYN |
skb_addr |
string |
十六进制重传队列 SKB 指针;SYN-ACK 和 TLP 事件中不存在。 |
drop_location |
string |
local 关联分类:software、hardware 或 unknown;匹配时与 drop_source 相同,与 dropwatch 的内核地址字段语义不同。 |
drop_source |
string |
匹配丢包的来源:software 或 hardware;无法识别 ABI 来源时为 unknown,未匹配时省略。 |
drop_reason |
string |
与 dropwatch 一致:软件丢包为 BTF 解析的 SKB_DROP_REASON_*,不可解析时为十进制数字,旧内核不支持时为 NOT_SUPPORTED;硬件丢包为 devlink trap 名称。 |
drop_reason_group |
string |
devlink trap 分组,如 l2_drops,用于聚合硬件丢包原因;软件丢包和未匹配事件省略。 |
correlation_reason |
string |
唯一终态:matched、unsupported、warmup、wait_timeout、queue_full 或 interrupted;未启用关联时省略。 |
matched_net_namespace |
bool |
同一 TCP flow 下观测到相同 namespace 的 drop,独立于报文和时间检查。严格匹配时必为 true;false 时省略。 |
drop_perf_status |
object |
未匹配事件的 embedded dropwatch 累计计数;map_counters_available 标记 map 计数是否可用,读取失败时仍保留有效的 reader lost_samples。 |
drop_stack |
string |
匹配到的 drop 调用栈;未匹配的栈不做符号化。 |
source |
string |
事件来源。独立运行 tcpshark 时为 tools,由 huatuo-bamai 启动时为 events。 |
icsk_pending 是 hook 时刻的定时器状态快照,不是重传原因的稳定枚举。TLP 分类以明确的 event_type=tcp_send_loss_probe 为准,不依赖 icsk_pending=5。
| 值 |
内核状态 |
含义 |
0 |
None |
当前没有待处理的发送定时器事件。 |
1 |
ICSK_TIME_RETRANS |
重传超时定时器(RTO)。 |
2 |
ICSK_TIME_DACK |
延迟 ACK;现代内核将该状态保存在 icsk_ack.pending 并使用独立的 delayed-ACK timer,因此通常不会出现在 icsk_pending 中。 |
3 |
ICSK_TIME_PROBE0 |
零窗口探测定时器。 |
4 |
版本相关 |
当前主线内核不再定义该值;旧内核曾将其用于 Early Retransmit,更早的内核曾用于 Keepalive。 |
5 |
ICSK_TIME_LOSS_PROBE |
Tail Loss Probe(TLP)定时器。 |
6 |
ICSK_TIME_REO_TIMEOUT |
乱序超时定时器,主要用于 RACK 丢包判断。 |
3.1 文本输出格式
文本输出保留面向终端的可读布局,同时覆盖与 JSON 相同的事件变量。可选变量仅在非零或非空时显示,字符串值不添加 JSON 引号或转义。为兼容原文本格式,state、skb、seq、end、ack、flags、ca、retrans 和 reason 分别对应 JSON 中的 tcp_state、skb_addr、tcp_seq、tcp_end_seq、tcp_ack_seq、tcp_flags、ca_state、icsk_retransmits 和 correlation_reason。
<timestamp> [<phase>/<tcp_reason>] <saddr>:<sport> > <daddr>:<dport> state=<STATE> event_type=<TYPE> [kernel_observed_timestamp=<UTC>] [SYNACK] [skb=<ADDR>] seq=<N> [end=<N>] ack=<N> [flags=<FLAGS>] pid=<N> comm=<COMM> ca=<N> retrans=<N> icsk_pending=<N> [reord_seen=<N>] [dsack_dups=<N>] [container_id=<ID>] [memory_cgroup_css_addr=<ADDR>] [net_namespace_cookie=<N>] [net_namespace_inum=<N>] [drop_location=<LOCATION>] [drop_source=<SOURCE>] [drop_reason=<REASON>] [drop_reason_group=<GROUP>] [reason=<REASON>] [matched_net_namespace=true] [dropwatch_map_counters_available=<true|false> dropwatch_perf_lost=<N> dropwatch_lost_samples=<N> dropwatch_rate_limited=<N>] [source=<SOURCE>]
示例:
2026-07-23T02:14:40.304775546Z [data/RTO] 127.0.0.1:19996 > 127.0.0.1:42128 state=ESTABLISHED event_type=tcp_retransmit_skb kernel_observed_timestamp=2026-07-23T02:14:40.304Z skb=0xffff931c14fdf800 seq=3154974646 end=3154991030 ack=948393597 flags=ACK|PSH pid=1420 comm=kube-apiserver ca=4 retrans=4 icsk_pending=0 net_namespace_inum=4026531992
示例中的 pid 和 comm 表示 hook 运行时的执行上下文;工作负载归属应使用 container_id 和 socket 元数据判断。
非空的 drop_stack 会作为事件行之后的缩进调用栈行输出,不使用行内 drop_stack= token。
3.2 容器 ID 解析
tcpshark 自身无法访问 Pod 管理器。独立输出时通常没有 container_id,但可用时仍会输出 socket memcg 和网络命名空间元数据。通过 huatuo-bamai 运行时,空的 container_id 按 memory_cgroup_css_addr、net_namespace_cookie、net_namespace_inum 的顺序解析。
全部解析未命中时,事件仍会存储,但 container_id 保持为空。pid 和 comm 描述的是 hook 执行上下文,不能作为判断 socket 归属的回退依据。
4. 内核事件与分类
4.1 内核挂载点
| 挂载点 |
内核位置 |
事件含义 |
可用数据 |
tracepoint tcp/tcp_retransmit_skb |
__tcp_retransmit_skb() |
对一个重传队列 SKB 发起了重传尝试;tcpshark 事件不保留内核发送结果。该 SKB 是 headerless 的,因此序列号来自 TCP_SKB_CB(skb),ACK 来自 tcp_sk(sk)->rcv_nxt。 |
SKB 指针、TCP seq/end_seq/ack/flags、socket 状态、CA 状态、定时器和乱序计数器。 |
tracepoint tcp/tcp_retransmit_synack |
tcp_rtx_synack() |
tcp_rtx_synack() 成功提交了一次被动建连 SYN-ACK 重传。 |
request socket 地址和端口;没有重传 SKB 指针及 TCP seq/ack。 |
kprobe tcp_send_loss_probe |
tcp_send_loss_probe() |
正在准备 Tail Loss Probe;仅在指定 --enable-tlp 时采集。 |
socket 元数据及 snd_nxt/snd_una;没有 SKB 指针或渲染后的 TCP flags。 |
BPF 程序通过 BPF_CORE_READ 等辅助方法执行 CO-RE 字段读取,因此在支持的内核布局上无需为每个内核版本重新编译 C 源码。
4.2 连接阶段
常规 SKB 事件的阶段由 sk_state 决定;SYN-ACK 事件在用户态使用固定阶段。
下面以 TCP 三次握手说明 connect 阶段及对应的重传观测点:
sequenceDiagram
    participant C as 客户端
    participant S as 服务端
    Note over C,S: 初始状态:CLOSED / LISTEN
    C->>S: ① SYN
    Note left of C: SYN_SENT(2)<br/>phase=connect
    opt SYN 未被确认
        C-->>S: SYN 重传<br/>tcp_retransmit_skb
    end
    Note right of S: SYN_RECV(3) 或 NEW_SYN_RECV(12)<br/>phase=connect
    S->>C: ② SYN + ACK
    opt 最终 ACK 未到达
        S-->>C: SYN-ACK 重传<br/>tcp_retransmit_synack
    end
    C->>S: ③ ACK
    Note over C,S: ESTABLISHED(1)<br/>后续常规数据 SKB 事件 phase=data
图中的三条实线表示首次握手报文,不会产生 tcpshark 事件;只有可选框中的重传路径会被观测。主动端 SYN 重传通过 tcp_retransmit_skb 上报,被动端 SYN-ACK 重传通过 tcp_retransmit_synack 上报,两者都归类为 connect。
完整阶段映射如下:
| 阶段 |
来源状态或事件 |
说明 |
connect |
SYN_SENT(2)、SYN_RECV(3)、NEW_SYN_RECV(12) 或 tcp_retransmit_synack |
连接建立。 |
data |
ESTABLISHED(1) 或无法识别/默认状态 |
数据传输或默认分类。 |
close |
FIN_WAIT1(4)、FIN_WAIT2(5)、TIME_WAIT(6)、CLOSE_WAIT(8)、LAST_ACK(9)、CLOSING(11) |
连接关闭。 |
4.3 原因分类
| 事件或条件 |
原因 |
含义 |
tcp_retransmit_synack |
RTO |
SYN-ACK 重试定时器路径的固定用户态标签。 |
tcp_send_loss_probe |
TLP |
可选 Tail Loss Probe hook 的固定用户态标签。 |
tcp_retransmit_skb,ca_state=4(Loss) |
RTO |
socket 当前处于 TCP_CA_Loss。 |
tcp_retransmit_skb,ca_state=3(Recovery) |
fast_retransmit |
Recovery 路径重传。 |
tcp_retransmit_skb,ca_state=0..2,connect/close 阶段 |
RTO |
当前分类器使用的阶段回退结果。 |
tcp_retransmit_skb,ca_state=0..2,data 阶段 |
unknown |
当前快照不足以生成其他标签。 |
分类器只观察 hook 时刻的 socket 状态,无法重建完整的 ACK/丢包历史。因此应把 tcp_reason 视为聚合标签,而不是经过验证的根因。
4.4 乱序启发式判断
4.5 运维解读
没有任何事件类型可以无条件丢弃。相比只按 event_type 或 tcp_reason 过滤,更推荐按速率、比例和服务影响设置阈值。通用的 huatuo-bamai 噪声过滤机制请参考 dropwatch 文档。
| 模式 |
通常优先级 |
建议 |
tcp_reason=RTO |
高 |
排查持续增长或与服务异常相关的 RTO;它通常比 Recovery 路径重传带来更大延迟影响。 |
tcp_reason=fast_retransmit |
中 |
结合丢包、拥塞及 SACK/RACK 行为分析。 |
tcp_reason=TLP |
视上下文而定 |
这是可选信号;用于告警前应确认已主动开启 TLP 采集。 |
event_type=tcp_retransmit_synack |
单次通常较低 |
重复出现可能意味着握手可达性、主机出口、防火墙、客户端或网络问题。 |
配置告警时,应按服务或连接聚合并结合流量规模判断。繁忙主机上的少量绝对计数可能无害,而低流量关键服务上的突发事件可能具有较大影响。
5. 与 dropwatch 关联
指定 --with-dropwatch 后,一个 tcpshark 进程持有两条 perf 输入。重传最多等待 100ms,让较晚送达用户态的 dropwatch 事件参与匹配;候选 drop 的内核单调时间必须早于重传且相差不超过 1s。embedded source 不输出 raw drop 文档;独立启用的 standalone dropwatch 仍是另一条 raw event stream。
关于双 perf stream 的读取乱序、100ms 到达窗口、1s 因果窗口及 negative evidence 的限制,参见
TCP retransmit 与 dropwatch 关联的难点。
与独立 dropwatch 一样,embedded source 自动检测并启用 devlink DROP trap 采集(HardwareAuto),无需额外硬件开关;tracepoint 不可用时输出 warning 并继续采集软件丢包。硬件可见性取决于驱动是否上报目标 DROP trap,条件见 dropwatch 硬件丢包说明。
--device、--device-excluded、--filter、--max-events-per-second 使用与 dropwatch 相同的参数名。网卡白名单/黑名单仅限制 embedded dropwatch,同时作用于其软件和硬件事件;白名单拒绝没有网卡信息的记录,黑名单允许这类记录。重传输入仍按共同的 L3 filter 采集,设备过滤可能减少可匹配的 drop 证据。
匹配后保留 drop_source、drop_reason 和硬件的 drop_reason_group。drop_reason 是观测到的丢包原因,tcp_reason 是重传触发分类,correlation_reason 是本次关联的唯一结束原因,独立诊断字段描述观测限制。BTF reason 表每次会话加载一次;加载失败时记录 warning,软件 reason 回退为数字,硬件 trap 解析不受影响。
# 使用与 dropwatch 相同的网卡和流量参数,查看匹配到的硬件 drop
sudo tcpshark --mode retransmit --with-dropwatch --bpf-path-dir bpf \
--device eth0 --filter "tcp and port 443" --output json \
| jq -c 'select(.drop_source == "hardware")'
硬件 drop 也必须满足相同的 namespace、TCP 和时间约束。缺少 namespace 或 TCP 匹配字段时保持未匹配;未匹配不能证明发生了硬件丢包。硬件 drop_stack 是驱动上报 trap 时的内核栈,不是 ASIC 内部的丢弃位置。
来源枚举未知时,匹配记录的 drop_source 和 drop_location 均为 unknown;不会根据 reason 或调用栈猜测来源;该记录仍输出 correlation_reason=matched。
5.1 关联结果
| 结果 |
必须满足的证据 |
输出 |
| 出方向 segment 匹配 |
network namespace、地址族、方向、四元组、单调时间顺序相同,且 SYN/data/FIN sequence range 重叠。 |
输出 correlation_reason=matched,以及丢包来源、原因和 drop_stack。 |
| 反方向 ACK 匹配 |
相同 namespace 中的反向四元组、ACK flag、单调时间顺序,且 ACK 覆盖重传 sequence end。 |
输出 correlation_reason=matched,以及丢包来源、原因和 drop_stack。 |
| 无严格匹配 |
缺少本地证据不能证明实际丢包位置。 |
drop_location=unknown、唯一的 correlation_reason 和独立诊断信息。 |
不存在仅四元组、仅 SKB pointer、跨 namespace 或 ambiguous 的正向匹配。matched_net_namespace 在报文和时间检查前记录同一 flow(任一方向)下相同 namespace 的 drop。该值为 true 不代表严格匹配成功,完整关联仍以 correlation_reason=matched 为准。false 或字段缺省表示尚未观测到 namespace 匹配,不代表已确认 namespace 不同。匹配到的 drop 只消费一次,同一连接的后续 drop 仍可继续匹配。只有成功匹配后才做调用栈符号化。
5.2 关联终态
每条已定型事件只有一个 correlation_reason:
| 值 |
含义 |
matched |
找到严格匹配的 drop,包括来源未知的已匹配记录。 |
unsupported |
事件缺少匹配规则要求的类型、namespace、时间或 sequence 证据。 |
warmup |
100ms 等待到期仍未匹配,且重传发生时间早于 embedded source ready。 |
wait_timeout |
100ms 等待到期仍未匹配,且重传发生时间不早于 embedded source ready;这里是关联等待超时,与 TCP 的 RTO 无关。 |
queue_full |
有界重传等待队列已满,该事件在到期前被淘汰。 |
interrupted |
关联循环退出,该事件尚未到期的等待被中断,包括正常停止和异常退出。 |
匹配和容量检查前先处理到期事件。退出时使用同一个时间点:已到期项为 warmup 或 wait_timeout,剩余等待项为 interrupted。每条事件只定型一次,随后移出队列。无法解码或从 drop 缓存淘汰的记录不会直接结束某条重传的关联。
单值字段替代原原因数组,tcpshark 与接收端需要配套更新。文本输出使用 reason=<值>;未启用关联时省略该字段。
warmup 仅用于等待到期且重传内核时间早于 embedded source ready 的事件。重传时间等于或晚于 ready 时,等待到期统一使用 wait_timeout,包括 ready 后不足 1s 的情况。drop 到重传的 1s 上限只约束候选匹配,不定义预热期。处理延迟不会改变分类。严格匹配、不支持、队列淘汰和提前中断保留各自原因。该终态表达观测时序,不证明未匹配的具体根因。
matched_net_namespace 保留为独立布尔诊断字段,同时用于已匹配和未匹配结果;可以与丢失计数同时存在,不改变终态原因。
退出时不再读取 dropwatch perf ring 中尚未交给关联器的记录;未读取的尾部 drop 原本仍可能与被中断的重传匹配。
5.3 Dropwatch Perf Status
每个非空输出批次在写出前读取一次状态,包括全部匹配的批次。未匹配事件保留状态快照:
| 字段 |
含义 |
map_counters_available |
两个 map 计数是否均可用;false 区分计数不可用与观测值为零。 |
perf_lost |
embedded dropwatch 未能写入 perf stream 的累计事件数;仅在 map 计数可用时有效。 |
lost_samples |
用户态 reader 从 PERF_RECORD_LOST 累计的丢失样本数;map 读取失败时仍有效,为零时省略。 |
rate_limited |
embedded dropwatch 被限速拒绝的累计事件数;仅在 map 计数可用时有效。 |
状态读取失败时,map_counters_available=false,perf_lost、rate_limited 的零值表示不可用,快照仍保留 lost_samples。先尝试输出本批事件,再返回状态错误;写出失败则停止该批次,并保留两个错误。已匹配事件保留 matched 与丢包元数据,不附加未匹配状态快照。
计数绑定本次 dropwatch 实例,重新加载时归零;map 与 reader 分别采样,不构成原子快照。它们不能证明某条重传未匹配的根因,丢失和限流也不会追加或替换关联原因。
5.4 使用条件与排查方式
| 观测结果 |
检查项 |
software |
结合 drop_reason、tuple、方向、sequence、namespace 检查匹配栈。 |
hardware |
按 drop_reason_group、trap 名称和驱动文档检查硬件丢包;匹配仍是基于报文证据的关联。 |
unknown 且 loss counter 非零 |
收紧共同 filter、增大 perf 容量或调整 embedded dropwatch 限速后重新采集。 |
correlation_reason=wait_timeout |
100ms 内没有严格候选;结合诊断标记和计数排查。 |
correlation_reason=queue_full |
等待队列已满,收紧采集范围。 |
correlation_reason=interrupted |
检查采集停止或错误,关联等待被提前结束。 |
matched_net_namespace=true,但关联未匹配 |
同一 flow 下已观测到相同 namespace 的 drop,继续检查报文和时间条件;该标记本身不构成完整关联。 |
correlation_reason=warmup |
等待到期,且重传发生时间早于 source ready;继续采集后续重传,本次结果无法排除 source ready 之前的丢包。 |
drop_location 不存在 |
off 模式。 |
huatuo-bamai 会向 local 关联的两个输入传入同一个规范化 EventTracing.TCPRetransmit.Filter。采集范围一致可以避免两个 source 观察不同流量,但在缺少可靠因果起点边界时,no-match 仍不能成为确定结论。
🌟 结尾